Nominal vs Usable Capacity — Battery Specs Decoded
Most scooter spec sheets list a big watt-hour (Wh) number, yet the real miles you get rarely match. The gap comes from nominal vs usable capacity—what’s printed versus what you can actually pull out on the road. This guide translates labels into realistic range and charge-time expectations, using simple math and rider-tested methods. If you’re comparing batteries and want a dependable decision workflow, start here, then skim your target models’ Electric Scooter Specifications and real-world Scooter Reviews to see how the numbers behave in practice.
Nominal vs Usable Capacity — The Core Difference
Nominal watt-hours (Wh) are the printed energy on a battery label, calculated from the nominal pack voltage and rated amp-hours:
- Nominal Wh = Nominal Voltage (V) × Rated Capacity (Ah)
It’s a convenient yardstick for comparing packs, but it assumes an ideal case.
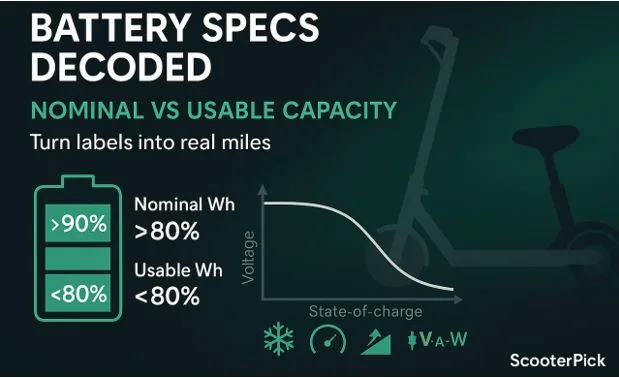
Usable watt-hours are the energy you can actually discharge while riding, within the battery management system’s (BMS) safe state-of-charge (SoC) window. The BMS intentionally holds back energy at the very top and bottom of the pack to protect the cells. Additionally, real riding introduces voltage sag (voltage drops under load), temperature effects, and other losses. Therefore, usable Wh is always less than nominal Wh.
In short: the BMS keeps the pack healthy; physics subtracts more; your display still reads 100–0%, but the cells are operating within a narrower safe window. That’s why nominal vs usable capacity diverges.
Battery Terms That Actually Matter
Use this mini-glossary to read spec sheets quickly.
- Voltage (V): Electrical “pressure.” Higher V can reduce current for the same power, lowering heat and sag.
- Capacity (Ah): How much charge the pack stores. Combine with voltage to get Wh (energy).
- Energy (Wh): Voltage × amp-hours. Best single number for range comparisons.
- C-rate: Discharge or charge rate relative to capacity (1C = full capacity in one hour). Higher sustained C demands stress cells more.
- Depth of Discharge (DoD): Percent of capacity used in a cycle. Lower DoD (shallower cycles) usually extends life.
- State of Charge (SoC): Percent remaining. Display SoC ≠ exact cell SoC.
- Internal Resistance: Cell/pack resistance. Higher resistance means more heat and voltage sag under load.
- BMS Cutoffs: Safety limits for high/low voltage and current. They protect the pack, but trim usable Wh.
- Voltage Sag: Temporary drop in voltage under load. Stronger at low temps, high current, or older packs.
- Taper (charging): Automatic reduction in current near the top of charge to protect cells; increases charge time.
From Label to Street — Simple Math You Can Trust
A few reliable rules carry you far:
- Label energy:
Wh = V × Ah
Example: 48 V × 15 Ah = 720 Wh (nominal). - Urban range rules of thumb (flat, mixed stops, moderate speed):
Conservative range (mi) ≈ Wh ÷ 20
Optimistic range (mi) ≈ Wh ÷ 18
(Assumes 15–18 Wh/mi riding. Add hills, cold, or high speed and you’ll use more Wh per mile.) - Charger power:
Charger W = Charge Voltage × Charge Current (A)
Example: 54.6 V charger at 2 A ≈ 109 W. - Charge time:
Ideal time (h) ≈ Battery Wh ÷ Charger W
Realistic time = Ideal × 1.15–1.30 (taper + losses).
These are not guarantees, yet they produce trustworthy starting ranges for most commuters.
Why Usable Capacity Shrinks in Real Life
Several factors reduce usable Wh compared with the label:
- BMS buffers: Your screen’s 100–0% is rarely the cells’ real 100–0%. Top and bottom buffers protect longevity and safety.
- Temperature: Cold thickens electrolyte and raises internal resistance, so usable Wh drops—often noticeably below ~50 °F (10 °C).
- Load and current spikes: Fast starts, steep hills, or heavy riders pull higher current, amplifying voltage sag and heat.
- Age and cycle wear: Over months and cycles, capacity and peak voltage slowly decline; so does power delivery.
- Speed and aerodynamics: Faster riding burns energy disproportionately. Even small speed jumps matter.
- Terrain and surface: Hills, rough asphalt, and gravel raise rolling losses.
- Tire type and pressure: Under-inflated tires and soft compounds increase drag.
- Drivetrain and firmware limits: Current caps, thermal limits, and conservative control maps keep cells safe, trimming top-end output.
As a rider, you can’t remove these influences, but you can account for them—especially temperature, speed discipline, and tire pressure.
Chemistry Matters (NMC vs LFP in Plain English)
Two mainstream chemistries feel different on the road:
- NMC (Nickel Manganese Cobalt):
- Voltage curve: Higher energy density and a more sloped discharge. Mid-pack feels lively, but power drops faster near the end.
- Sag behavior: Typically more pronounced sag under heavy load than LFP of the same capacity.
- Longevity: Solid with proper care, yet less cycle-life than LFP.
- Daily feel: Strong punch when warm; range can shrink in cold due to sag.
- LFP (Lithium Iron Phosphate):
- Voltage curve: Flatter during the middle, so output feels consistent until nearer the end.
- Sag behavior: Often lower sag at similar currents; excellent stability.
- Longevity: High cycle life; chemistry is thermally robust.
- Daily feel: Slightly heavier per Wh; but consistent power delivery over the ride.
Partial-charge habits (20–80%): Both chemistries appreciate moderate SoC storage. LFP is more forgiving near 100%, while NMC benefits more from not staying full and hot. Either way, avoid extreme heat, and don’t store long-term at 0% or 100%.
This chemistry context helps you interpret nominal vs usable capacity on the road: LFP’s flatter curve and lower sag can make the last miles feel steadier, while NMC’s energy density can deliver lighter packs for a given Wh.
Test It Yourself — A Fair, Repeatable Method
You can estimate your usable Wh without opening the battery.
Pre-ride setup
- Note rider + gear weight.
- Set tire pressure to spec (cold).
- Record temperature and wind.
- Pick a standard loop (flat, low traffic, minimal stops).
- Start around 100% indicated SoC; warm the pack with 5–10 minutes of easy riding.
The ride
- Cruise at a steady, commuter-like speed.
- Stop the test at 15–20% indicated SoC.
- Record distance (miles) and percent used (e.g., 80% used).
Extrapolate
- Miles at 100% ≈ Miles ridden ÷ (Percent used / 100).
- Wh per mile (estimate) ≈ Nominal Wh ÷ Miles at 100% (first pass).
- Usable Wh (better estimate) ≈ Miles at 100% × Realistic Wh/mi for your style/temps.
- If your loop is mild and you rode smoothly, try 18–20 Wh/mi.
- If you rode fast or it’s cold, try 22–25 Wh/mi.
Optional: charge-in measurement
- Use a wall energy meter to measure watt-hours to recharge from the test finish back to 100%.
- Note: Wall energy includes charger and BMS losses, so expect ~10–20% more than pack energy added.
Repeat the same loop a few times in different temps to learn your personal range window.
Worked Examples (Round Numbers)
Example A: 36 V × 10 Ah
- Nominal Wh: 36 × 10 = 360 Wh.
- Conservative range (mi): 360 ÷ 20 = 18 mi (29 km).
- Optimistic (mi): 360 ÷ 18 = 20 mi (32 km).
Usable window: With BMS buffers, sag, and normal riding, assume ~85% of nominal on a mild day:
- Usable Wh ≈ 0.85 × 360 = 306 Wh.
- Realistic range: 306 ÷ 20 ≈ 15.3 mi (25 km) conservative; 306 ÷ 18 ≈ 17 mi (27 km) optimistic.
Takeaway: The label says 360 Wh, yet usable often feels like 300–320 Wh in everyday urban riding.
Example B: 48 V × 15 Ah
- Nominal Wh: 48 × 15 = 720 Wh.
- Conservative range: 720 ÷ 20 = 36 mi (58 km).
- Optimistic: 720 ÷ 18 = 40 mi (64 km).
Summer day (~70–80 °F / 21–27 °C):
- Assume ~85–90% usable due to moderate temps and steady pace.
- Usable Wh: ~612–648 Wh → 30.6–36 mi conservative; 34–36 mi optimistic depending on speed and starts.
Cold day (~35–45 °F / 2–7 °C):
- Expect more sag and higher Wh/mi; assume ~70–80% effective usable.
- Usable Wh: ~504–576 Wh → 25–29 mi conservative; 28–32 mi optimistic (if you slow down and keep tires firm).
Charging math (2 A charger at 54.6 V ≈ 109 W):
- Ideal time: 720 ÷ 109 ≈ 6.6 h.
- Realistic (×1.2): ~8.0 h.
- Faster chargers reduce time, but check your pack’s recommended maximum current.
Label assumptions are estimates, not guarantees. Conditions vary, and your controller’s current limits, thermal rules, and speed choices all shift Wh/mi.
Spec Sheet Sanity Checks (Before You Buy)
- Look for Wh. If only V and Ah are listed, multiply to get Wh. Compare on Wh first.
- Check the charger plate: Voltage and current tell you charger W and expected charge time.
- Do times make sense? If claimed “full charge in 3 hours,” but charger is 84 W and pack is 720 Wh, that’s not realistic.
- Controller current limits: Big batteries with tiny current caps may cruise far but feel sleepy off the line.
- Rider/test conditions: Real range depends on speed, temp, weight, and terrain; be wary of single “best case” numbers.
- Red flags: Missing Wh, peak-only wattage without continuous ratings, or tiny packs advertised with huge range claims.
Capacity vs Performance — When “Less” Still Feels Better
A smaller pack can feel punchier if its controller allows higher current and the wiring/thermal design supports it. Meanwhile, a larger pack with conservative current limits may feel mellow, even if it rides longer. Moreover, lighter scooters with mid-size batteries can be easier to live with: they carry upstairs well and charge faster on modest chargers. Decide which you value most—range vs responsiveness vs portability—and match the battery, controller, and weight to your real routes.
Daily charging strategies matter, too. If you ride 8–12 miles (13–19 km) per day, a mid-size pack kept between 20–80% can deliver long life and reliable performance. Top up before long rides, and avoid storing full in heat.
Table 1: Spec Term → Plain Definition → Why It Matters → Quick Check
| Spec Term | Plain Definition | Why It Matters | Quick Check |
| Voltage (V) | Electrical pressure | Higher V can reduce current for same power | Does V align with motor/controller? |
| Capacity (Ah) | Stored charge | Combine with V to get energy (Wh) | Multiply V×Ah to compare packs |
| Energy (Wh) | Total stored energy | Best single predictor of range | Prefer Wh over Ah alone |
| C-rate | Rate per capacity | High C stresses cells; affects heat | Stay within rated charge/discharge |
| DoD | % of capacity used | Lower DoD improves cycle life | Daily 20–80% is pack-friendly |
| SoC | % charge remaining | Display ≠ true cell SoC | Expect buffers at top/bottom |
| Internal Resistance | Opposition to current | Higher = more heat and sag | Drops with warm pack, rises in cold |
| BMS Cutoffs | Safety thresholds | Protects cells; trims usable Wh | Respect limits; don’t bypass |
| Charger Power | V × A at charger | Controls charge time | Time ≈ Wh ÷ charger W × 1.2 |
| Voltage Sag | Drop under load | Reduces power and usable Wh | Eases with slower speeds, higher PSI |
Table 2: Conditions That Reduce Usable Capacity → Typical Effect → What To Do
| Condition | Typical Effect | What To Do |
| Cold weather (<50 °F / 10 °C) | Higher sag; shorter range | Pre-warm ride; reduce speed; keep tires firm |
| High sustained speed | Wh/mi spikes | Cap cruise speed; draft less; plan range |
| Hills & frequent stops | More current; heat | Smooth throttle; plan conservative range |
| Under-inflated tires | Rolling drag | Check PSI weekly; use quality gauge |
| Rough surfaces | Energy losses | Pick smoother lines; lower speed |
| Heavy rider/cargo | Higher current draw | Expect fewer miles; choose bigger Wh |
| Aggressive acceleration | Extra sag & heat | Roll on throttle; ride efficiently |
| Aging pack | Capacity loss | Adjust expectations; service if needed |
| Storage at full & hot | Faster degradation | Store cool; avoid long stays at 100% |
| Very soft compounds | Grip trades for range | Inflate properly; consider tire choice |
Table 3: Nominal Pack Examples (Wh) → Conservative Range (mi) → Optimistic Range (mi) → Notes/Assumptions
| Nominal Pack (Wh) | Conservative (mi) | Optimistic (mi) | Notes |
| 300 | 15.0 | 16.7 | Flat urban pace; mild temps |
| 360 | 18.0 | 20.0 | Light commuter use |
| 480 | 24.0 | 26.7 | Mid-size pack; mixed stops |
| 540 | 27.0 | 30.0 | Faster cruise trims miles |
| 600 | 30.0 | 33.3 | Add margin for hills |
| 720 | 36.0 | 40.0 | Common long-range class |
| 840 | 42.0 | 46.7 | Heavier; check charger watts |
| 1000 | 50.0 | 55.6 | Watch claimed charge times |
Values assume typical 15–18 Wh/mi and mild temperatures; adjust for your weight, speed, and conditions.
FAQs
1) What does nominal capacity mean?
It’s the label energy, computed from nominal voltage and rated amp-hours (Wh = V × Ah), under ideal assumptions.
2) What is usable capacity?
It’s the energy you can actually pull during riding within the BMS’s safe SoC window, after temperature, sag, and other losses.
3) Why doesn’t my range match the spec sheet?
Spec sheets reflect ideal math or best-case conditions. Cold, speed, hills, and BMS buffers reduce usable Wh and increase Wh per mile.
4) How do I estimate realistic range quickly?
Use Wh ÷ 20 (conservative) and Wh ÷ 18 (optimistic). Then temper results for cold, hills, and speed.
5) Does fast charging hurt batteries?
Higher charge current increases heat and stress. Stay within the recommended current and avoid keeping the pack full and hot.
6) How does chemistry change the ride?
NMC has higher energy density but more sag near the bottom. LFP is steadier mid-pack with excellent cycle life, but heavier per Wh.
7) How do I test my own scooter’s nominal vs usable capacity?
Ride a standard loop from full to ~15–20% indicated SoC, log miles, and extrapolate. Optionally measure wall energy for a charge-in reference.
8) Will partial charging (20–80%) extend life?
Yes, moderate SoC storage and avoiding heat are friendlier for most lithium chemistries.
Glossary (Plain English)
- Nominal Voltage: The label voltage used for calculations, not the exact live voltage at all times.
- Usable Capacity: The portion of energy you can draw while the BMS keeps cells in a safe SoC window.
- Depth of Discharge (DoD): How much of the battery you use in a cycle (percent).
- State of Charge (SoC): The battery’s charge percent; your display is an estimate within BMS limits.
- C-rate: Charge or discharge rate in units of capacity per hour (1C equals full capacity in one hour).
- Internal Resistance: Pack’s resistance to current; higher values cause heat and voltage sag.
- Taper: Automatic reduction in charge current near full to protect cells.
- Voltage Sag: Temporary voltage drop during heavy load; stronger in cold or at high current.
- BMS (Battery Management System): Electronics that protect cells from unsafe voltage/current/temps.
- Wh (Watt-hour): Energy unit; best for comparing range potential.
- Ah (Amp-hour): Charge capacity; combine with voltage to get energy.
- Nominal vs Usable Capacity: The difference between label energy and what you can pull in real riding.
- Cycle Life: Number of charge/discharge cycles before capacity falls to a set threshold.
- Charge Voltage: The charger’s target voltage, typically higher than nominal pack voltage.
- Thermal Runaway: Dangerous chain reaction from overheating; avoid abuse, damage, or improper charging.
Printable Checklist — From Label to Realistic Range
- Note V and Ah; compute Wh = V × Ah.
- Confirm charger voltage and current to estimate charge time.
- Apply range window: Wh ÷ 20 (conservative), Wh ÷ 18 (optimistic).
- Adjust for temperature, hills, speed, and weight.
- Set tire PSI to spec (cold).
- Record rider + gear weight.
- Pick a standard loop and ride from full to ~15–20% indicated SoC.
- Log miles and percent used; extrapolate usable Wh.
- Repeat in different temps to learn your range window.
- Store the pack cool, avoid long sits at 0% or 100%.
Final Notes on Safety and Care
Never open a battery pack. Follow your scooter’s manual for charging, storage, and temperature limits. If the pack is damaged, overheats, or behaves oddly, stop using it and seek professional service.