How I Finally Made Money: The 3 Free Metrics I Tracked Instead of Downloads
Downloads Are a Lie. Retention is Your Reality.
I have a confession to make: For the first year of my side project, I was obsessed with downloads. I’d brag to my friends about hitting 10,000 installs. Sounds impressive, right?
Here’s the gut-punch: My bank account was empty.
I was so focused on the Vanity Metric (downloads) that I ignored the Reality Metric: Churn. It turns out I was pouring water into a leaky bucket. Those 10,000 users downloaded the app, opened it once, and vanished forever.
The hard truth is, retention is the new acquisition. You don’t need a fancy $500/month analytics suite to fix your leaky bucket. You just need to look at three numbers available in your free console (App Store Connect or Firebase) right now.
1. The First 24 Hours: Is Your Onboarding Broken?
This is the most brutal metric, but it’s the most honest.
The Metric: Day 1 Retention (D1R). The percentage of users who open your app on the day after they downloaded it.
Why It Matters: If a user doesn’t come back on Day 1, you failed the “first date.” Your app didn’t deliver the promised value immediately, or your onboarding was confusing. This metric validates your First-Time User Experience (FTUE).
The Benchmark: A decent D1R is usually around 25-30%. If you’re below 20%, stop everything else and fix your first 60 seconds.
Your Action:
- Pull the Number: Go to your analytics console and find your D1R.
- Trace the Drop: If it’s low, assume your onboarding is broken. Find the first step (e.g., the sign-up screen, the permissions request, or the empty state) where users quit. Simplify. Remove distractions. Deliver the “Aha!” moment immediately. If your app is a photo editor, let them edit a photo immediately, then ask them to sign up later.
2. Habit vs. Utility: How to Know If They’ll Ever Come Back
Your app falls into one of two categories: a Utility (used occasionally, like a tax calculator) or a Habit (used daily, like a social media feed or a meditation app). This metric tells you which one you built, and if you’re meeting user expectations.
The Metric: WAU/MAU Ratio (Weekly Active Users / Monthly Active Users).
Why It Matters: This ratio shows how frequently your users return.
- A ratio closer to 0.25 (1:4) means they use the app about once a month (pure utility). Fine for a niche tool, bad for a consumer app.
- A ratio closer to 0.50 or higher (1:2) means they use the app frequently (a true habit).
Your Action:
- Be Honest: Does your app need to be a habit? If yes, and your ratio is low, you need a “Daily Loop.”
- Add the Hook: Introduce habit-forming elements: Streaks, Daily Check-ins, or Personalized Notifications. The goal isn’t to annoy them, but to provide a small, immediate reward for returning. I added a simple “daily progress score” to my app, and my WAU/MAU jumped from 0.30 to 0.45 in a month.
3. The Revenue Leak: Finding the Exact Screen Where Users Quit
Downloads and retention are great, but the ultimate goal is monetization. The biggest leak in your bucket isn’t just users leaving; it’s users leaving right before they pay.
The Metric: Funnel Drop-off Rate (Free User to Paid Conversion).
Why It Matters: It pinpoints the exact friction point that is costing you money. The problem isn’t always the price; it might be the presentation of the price.
Your Action:
- Map Your Funnel: Use your analytics dashboard to map the user journey: Screen 1 (Free App) -> Screen 2 (See Paywall) -> Screen 3 (View Pricing) -> Screen 4 (Start Trial).
- Find the Spike: Where does the biggest drop occur?
- Drop between S2 and S3? Your paywall messaging is weak or confusing.
- Drop between S3 and S4? Your pricing is too high, or the trial terms are scary (e.g., hidden auto-renewal).
Indie Insight: I found a massive drop-off on my pricing screen. The fix wasn’t lowering the price; it was simply adding a clear list of what the paid version doesn’t include (no ads, no limits). Clarity always beats complexity.
Final Thoughts: Data Doesn’t Need a Data Scientist
Forget the buzzwords. As an indie developer, your advantage is speed and focus.
You don’t need fancy AI models to tell you that a D1 Retention below 20% means disaster. You just need to focus on these three simple, free numbers every single week.
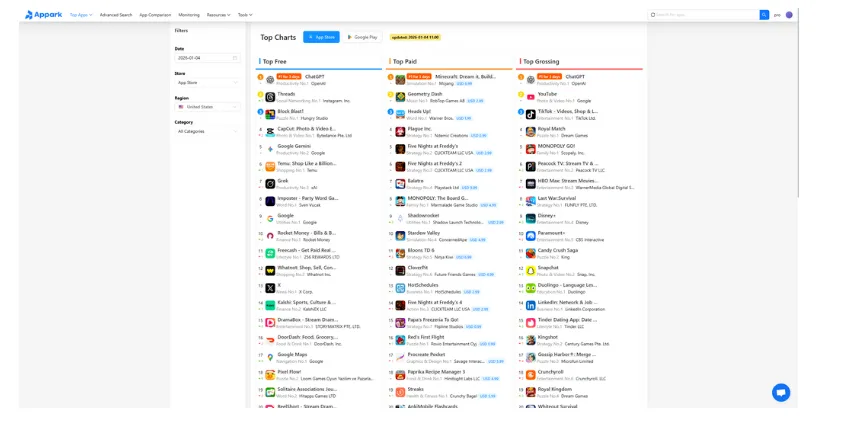
Tool Tip: While your console gives you your own metrics, tools like Appark charts are a huge advantage because they let you check key revenue-related data for your top competitors, helping you benchmark your monetization strategy against the market.
Your Next Step: Stop checking your daily download count. Log into your console right now and find your Day 1 Retention. If it’s low, that’s your priority for the next sprint.