Small Caps Surge as Russell 2000 Outpaces S&P 500 in 2026 Rotation
For more than a decade, the same story dominated U.S. equity markets: large-cap technology stocks, particularly the so-called Magnificent Seven, drove the bulk of S&P 500 returns while small caps lagged. In April 2026, that narrative cracked in a single month.
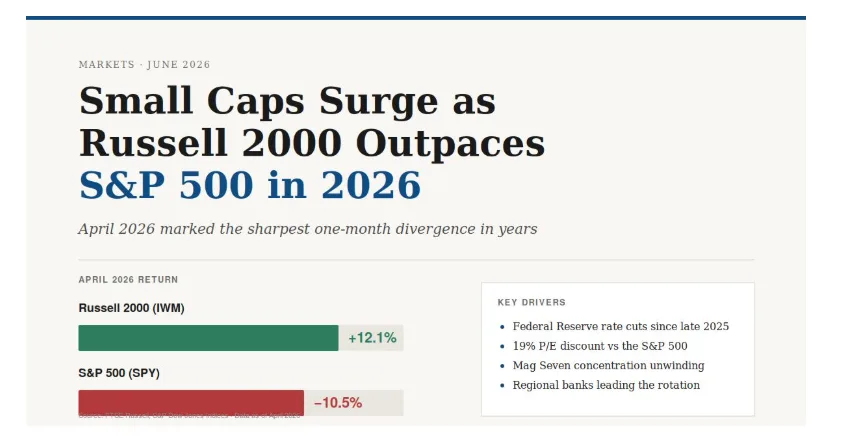
The iShares Russell 2000 ETF (IWM) returned roughly 12.1% in April, while the SPDR S&P 500 ETF (SPY) fell about 10.5% over the same period. That kind of divergence between large-cap and small-cap U.S. equities, in a single trading month, is historically rare. It has reignited a debate that retail and institutional investors have been having for years: is the long-running large-cap dominance finally rolling over?
This article looks at what triggered the rotation, how durable it might be, and what data investors should actually be watching now.
What Is Driving the 2026 Small-Cap Rotation?
The 2026 small-cap rotation is being driven primarily by three forces working together: the Federal Reserve’s late-2025 interest rate cuts, valuation compression in mega-cap technology, and a Russell 2000 P/E discount of roughly 19% relative to the S&P 500. Each of these on its own would matter. Together, they explain the speed of the shift.
The Federal Reserve began cutting rates in the final quarter of 2025 after holding policy restrictive for nearly two years. Lower rates disproportionately benefit small-cap companies, which tend to carry more floating-rate debt and rely more heavily on regional bank credit than mega-cap multinationals.
The second force is valuation. The S&P 500 entered 2026 trading at roughly 25.2 times trailing earnings, near the top of its historical range. The Russell 2000, by contrast, traded at approximately 20.4 times earnings — a discount that hadn’t appeared in years.
The third force is concentration risk. As of early 2026, the top ten holdings of the S&P 500 account for more than 40% of total index weight, with Nvidia alone commanding roughly 12.7%. That structural imbalance has made the index increasingly sensitive to a small handful of names. When sentiment toward those names cools — even briefly — the entire index can move sharply.
How Significant Is a 22-Point Monthly Divergence?
A 22-percentage-point gap between the Russell 2000 and the S&P 500 in a single month is an extreme event by any historical measure. Monthly correlation between the two indices has averaged roughly 0.8 over the past two decades. The April 2026 reading was one of the lowest in that period.
To put it in context, the average bear market for U.S. large-cap equities since 1928 has lasted just under ten months, according to Ned Davis Research. Single-month moves of more than 10% in either direction typically cluster around major macro inflection points — recession onsets, Fed pivots, or external shocks.
Whether April 2026 marks a similar inflection point is now the central question for asset allocators. Some Wall Street strategists view the rotation as the start of a multi-year leadership change, similar to the 2000–2006 period when small caps outperformed large caps by a wide margin after the dot-com bust. Others see it as a sharp but temporary rebalancing that will fade once the Fed cuts are fully priced in.
What Does This Mean for Retail Investors?
Retail investors are increasingly active in deciding which side of this rotation they want exposure to, but most are doing so without a clear understanding of what each index actually represents. The Russell 2000 and S&P 500 are not “big version” and “small version” of the same thing. They hold different sectors, different revenue profiles, and different risk characteristics.
The S&P 500 is now effectively a concentrated bet on global mega-cap technology. Information Technology alone accounts for roughly 34.6% of the index. Roughly 40% of S&P 500 company revenue is generated outside the United States, making it sensitive to currency moves and global growth.
The Russell 2000 is the opposite. Its largest sector is Financials — driven primarily by regional and community banks — followed by Industrials and Health Care. Russell 2000 companies generate the bulk of their revenue domestically. Roughly 30–40% of constituents have been unprofitable in recent years, which contributes to the index’s higher volatility.
Independent finance education site thefintechzoom.it.com recently published a detailed comparison of the two indices, noting that the structural differences between them are large enough that holding both is meaningfully different from holding either one alone. For investors who have built their U.S. equity exposure entirely around S&P 500 index funds over the past decade, the April rotation is a reminder that sector and size concentration carries real risk even within a “diversified” 500-stock index.
What Should Investors Actually Watch Now?
There are four data points worth following as the 2026 rotation develops. None of them, in isolation, predicts the next move. Together, they offer a clearer picture of whether the small-cap rally is sustainable or already fading.
- The yield curve and credit spreads: Small caps depend heavily on access to credit. If high-yield bond spreads widen meaningfully, it usually signals stress that hits Russell 2000 components first.
- Profit margins among unprofitable Russell 2000 names: The roughly one-third of small caps that lost money over the trailing twelve months are the most rate-sensitive part of the index. If their earnings trajectory improves alongside falling rates, the rotation has more room to run.
- Mag Seven earnings revisions: As long as the largest S&P 500 names continue to deliver double-digit earnings growth, the index’s concentration premium can sustain itself. If revisions turn negative — even modestly — the relative case for small caps strengthens further.
- Russell 2000 P/E versus its own history: The current 20.4x multiple looks cheap next to the S&P 500. It is not historically cheap on an absolute basis. Small caps traded at 13–15x earnings during prior generational buying opportunities. A discount relative to large caps is not the same as a bargain.
A Comparison of the Two Indices Today
| Metric | S&P 500 | Russell 2000 |
| Number of holdings | ~500 | ~2,000 |
| Largest sector | Information Tech (~34.6%) | Financials |
| Top 10 weight | ~40% | <5% |
| Trailing P/E (early 2026) | ~25.2x | ~20.4x |
| Trailing 10-yr annualized return | ~15.6% | ~11.1% |
| Max drawdown (last decade) | -33.8% | -41.8% |
| Revenue source | ~60% U.S. / 40% global | Primarily U.S. |
| Profitability requirement | Yes (inclusion criteria) | None |
Data approximated from FTSE Russell, S&P Dow Jones Indices, and public market data as of early-to-mid 2026.
What the Rotation Is Not
It is worth being clear about what April 2026 did not establish. A single month of small-cap outperformance does not confirm a regime change. The Russell 2000 has produced multiple sharp counter-trend rallies during the past decade — in late 2020, again in early 2024 — that ultimately faded.
The 2000–2006 small-cap leadership cycle, which is now being referenced frequently, took place against a very different macro backdrop: a deflating tech bubble, a weak dollar, and a steepening yield curve. Conditions today share some of those features but not all of them.
Investors who reposition their entire equity allocation based on one month of data are taking a directional bet, not building a diversified portfolio. Most evidence-based long-term portfolios maintain exposure to both market segments and rebalance periodically rather than chase whichever side recently won.
Frequently Asked Questions
Why did the Russell 2000 outperform the S&P 500 in April 2026?
The Russell 2000 outperformed primarily because of falling interest rates, valuation compression in mega-cap technology, and a roughly 19% P/E discount relative to the S&P 500. Small caps tend to benefit more from rate cuts than large caps because they carry more floating-rate debt and depend more on regional bank lending.
Is the small-cap rally sustainable?
It depends on the path of interest rates, the trajectory of Magnificent Seven earnings, and whether unprofitable Russell 2000 companies see margins improve. A single month of outperformance does not confirm a multi-year leadership change. Historical small-cap rotations have typically required sustained macro support to persist beyond a few quarters.
Should retail investors switch from S&P 500 ETFs to Russell 2000 ETFs?
Most evidence-based portfolios hold both rather than rotating fully into one. A common allocation pairs an S&P 500 core position with a 10–20% Russell 2000 satellite. Rotating entirely based on one month of data carries significant timing risk, particularly given the Russell 2000’s deeper historical drawdowns.
Which ETFs track the Russell 2000?
The two primary ETFs tracking the Russell 2000 are IWM (iShares, 0.19% expense ratio) and VTWO (Vanguard, 0.07%). Both track the same underlying index, but VTWO is meaningfully cheaper over long holding periods. Cost difference compounds significantly over 20-year horizons.
Is the S&P 500 still considered diversified?
By some measures, yes; by others, no. The index holds 500 companies, which sounds diversified. However, the top ten holdings now represent more than 40% of total weight, and Information Technology alone makes up roughly 34.6% of the index. By concentration measures, the S&P 500 is the least diversified it has been in modern history.
The Bottom Line
The April 2026 rotation between the Russell 2000 and S&P 500 was historically large but historically common in direction. Small caps have rotated into leadership before, and they have rotated back out. What makes this cycle worth watching is the combination of Fed cuts, mega-cap concentration, and a valuation gap that has not appeared in years.
For long-term investors, the most useful response is not to predict which side wins the next quarter. It is to look honestly at current portfolio concentration, understand what each index actually represents, and ensure exposure matches both risk tolerance and time horizon. Whether April 2026 marks the beginning of a multi-year shift or a single sharp month, the rotation has already done one useful thing: it has reminded investors that the S&P 500’s last-decade dominance was a feature of a specific macro environment, not a permanent feature of markets.