How University Students Can Spot Misleading Statistics in Breaking News
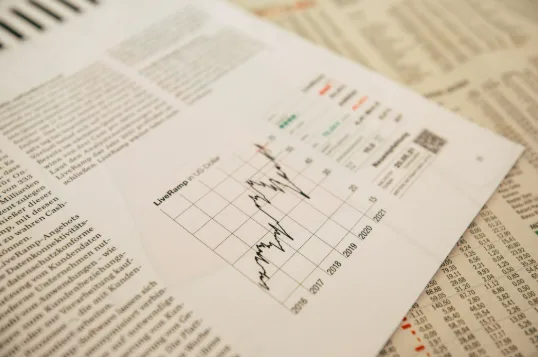
Breaking news moves fast, but good statistical work takes time. Reporters often deal with incomplete data, preliminary estimates, and limited expert commentary.
So, dramatic numbers can turn up before anyone has had a chance to explain what they actually mean. A percentage can be accurate and still misleading. A graph can be technically correct and still visually distorted.
Statistics are a common part of the news university students encounter, whether it concerns elections, health, crime, jobs, climate, or education. Teaching students to challenge these figures helps them become better-informed readers.
The goal is not to distrust all numbers. Rather, students need to be aware of how data might be framed, simplified, or presented without sufficient context.
Start With the Original Source
A news article may quote a government report, survey, university study, company statement, or social media post. Don’t accept the number until you check the original source.
Secondary stories sometimes condense complex conclusions into a single headline. During this process, important details can be lost.
Find out who collected the data and why. Usually, a national statistics office follows published methods. A company survey may have commercial motives, but that does not mean it is automatically unreliable.
Students should also know the difference between a full study and a premature announcement. Preliminary results are occasionally used for breaking news and may later be revised.
Open the original report if possible. Learn about the sample, research method, dates, limitations, and funding.
Check the Sample Size
A statistic based on 50 people is not the same as a statistic based on 50,000 people. In general, smaller samples are more sensitive to anomalous responses.
Imagine a newspaper headline saying that most university students are in favour of a new campus policy. The result sounds impressive until you find out that just 80 students participated.
Sample size alone does not ensure quality. A large sample can be misleading if researchers ask the wrong group.
For example, an online survey about student debt may draw people who feel strongly about the topic. Their experiences may not reflect those of the wider student population.
Ask how participants were selected. Random and representative samples are frequently more convincing than voluntary surveys on social media.
Compare Percentages With Actual Numbers
Percentages can exaggerate the importance of small changes. A headline might say that an occurrence increased by 100 percent, immediately generating a sense of urgency.
But going from one case to two cases is also a 100 percent increase. That’s the correct percentage, but the absolute change is small.
Whenever possible, try to find the actual numbers behind the percentage. Ask how many individuals, cases, votes, or incidents there were. This step becomes especially important when students work with datasets in statistics, economics, or research methods courses. A headline may provide the final percentage without showing the calculations that produced it. Students handling data-heavy coursework may turn to Excel homework help when a complex assignment requires formulas, tables, and careful interpretation. Even then, they should compare every figure with the original source and check whether cells, ranges, or formulas were selected correctly. Recalculating the percentage can reveal rounding issues, missing values, or misleading comparisons. It also helps students distinguish a genuine change from a dramatic claim built on a very small base.
Relative risk might be particularly problematic in health reporting. A treatment might reduce a particular risk by 50 percent. However, the actual risk may fall from two cases in a thousand to one.
Both numbers are important. The relative reduction sounds dramatic, while the absolute reduction shows the practical scale.
Look for a Clear Comparison Point
Numbers are only significant when readers have something to compare them with. Headlines in breaking news stories often do not make that reference point apparent.
Suppose a report states that rent is at its highest level. Highest since when? The previous month, the past decade, or the start of data collection?
Writers can choose a comparison period that makes the shift look more dramatic. One unusual month can cause a large year-over-year jump.
Seasonality matters too. Sales in retail stores tend to increase in the weeks before holidays. Activity on campus differs during examination periods and summer break.
Students should think about several time periods, not just one easy comparison. A longer trend can convey quite a different story.
Question Averages
Averages are often used in news stories because they are easy to communicate. Unfortunately, the term “average” can disguise large variations within a group.
The mean is obtained by summing all values and then dividing by the total number of observations. It can also change quickly because of extreme values.
The median is the midpoint value. The mean can be affected by a few extremely large figures, so the median may provide a clearer picture.
Take a hypothetical set of graduates. One person earns an insanely high wage. The average is impressive, but most graduates earn much less.
If the article talks about average salaries, house prices, debt, or study time, check which average is being used. The discrepancy could alter the conclusion.
Do Not Confuse Correlation With Causation
Two trends can go together without one causing the other. The problem occurs regularly in the reporting of health, education, and social behaviour.
A study may show that students who sleep more get better marks. However, that does not mean extra sleep is directly responsible for academic achievement.
There may be other factors affecting both outcomes. These students may have lighter work schedules, healthier routines, or better access to study materials.
Words such as “linked,” “associated,” and “connected” generally describe correlation. Headlines may replace them with stronger terms that imply cause and effect.
Researchers need more evidence to support a causal claim. Students should be cautious when a news report reduces an association to a simple explanation.
Examine How the Question Was Asked
The wording of survey questions is quite sensitive. Small adjustments to a question can affect how people respond.
Compare these hypothetical questions:
“Should universities censor dangerous content on the internet?”
“Should universities restrict students’ access to online information?”
Both may refer to a similar policy. However, words such as “dangerous” and “restrict” trigger different emotional reactions.
The precise question may not be shown in the news coverage, but the outcome is published. This omission makes the statistic difficult to evaluate.
Check whether neutral response options were available to participants. Surveys that put people into boxes may not reveal the full story of what they think.
Notice Missing Groups
A dataset may appear to be complete but still miss key parts of the population. These missing groups might influence the interpretation of the findings.
An online survey might miss people with limited internet access. A telephone poll may exclude people who rarely answer when a stranger calls.
Research on university students may be restricted to full-time undergraduates. It may not be relevant to postgraduate, international, online, or part-time students.
Note who was included and who was missing. A generic headline can overstate the findings from a specific population.
Study the Graph, Not Just the Headline
Charts can convey information quickly, which is helpful in fast-moving news situations. They can also give a false impression.
A typical strategy is to truncate the vertical axis. A minor difference then seems much larger than it really is.
A trend can also be distorted by uneven time periods. A graph may show one month next to ten years without indicating that difference.
Another problem is the use of 3D charts. Decorative shapes can overstate the apparent size of one category.
Students need to look at the axis labels, units, dates, scale, and starting point. A good graph should make the comparison easier, not more dramatic.
Watch for Cherry-Picked Data
Cherry-picking is when a person chooses evidence that supports a claim and ignores evidence that does not.
A news story can focus on one month of declining unemployment. However, the longer-term trend may show little improvement.
Another article could highlight a success story at one university and not mention the many universities where the same policy failed.
Look for data covering an adequate period and a large population. Isolated cases can be interesting, but they rarely show a general pattern.
Pay Attention to Uncertainty
Statistics are seldom exact. Surveys have margins of error. Forecasts contain uncertainty. Early estimates are subject to revision.
Election coverage is a classic example. If the margin of error is greater, a candidate who is ahead by two percentage points may not actually be ahead.
Confidence intervals and probability measures are also used in scientific research. These nuances are typically left out of headlines because they do not sound as interesting.
Phrases such as “may,” “suggests,” and “early evidence indicates” do not signal poor reporting. They can be viewed as indicators of responsible treatment of uncertainty.
When a complex prediction is made with total confidence, students should be suspicious.
Separate Statistical Significance From Practical Importance
A finding may be statistically significant yet not have a substantial effect in real life.
With a very large sample size, researchers can find a very small change that probably will not matter to most people. The headline can still claim that it is a huge discovery.
Practical importance asks whether the effect is large enough to matter. A study tool might boost exam scores by a fraction of a percent.
That result might be statistically measurable, but it may have little educational value. Students need to know the effect size and what it means in the real world.
Compare Several Reliable Reports
Few articles capture the full story in breaking news, but one article can come close. Different outlets will select different statistics from the same report.
Compare coverage from several well-established news organisations. If the subject is medicine, economics, science, or public policy, also check specialist publications.
Discrepancies between reports can reveal missing context. One outlet might discuss the sample size, while another explains the historical trend.
The point is not to find an article that validates a pre-existing opinion. Instead, students should pursue the most comprehensive explanation.
Use a Simple Statistical Checklist
Before you share a stunning statistic, ask some fundamental questions. Where did the number originate? How large and representative was the sample?
Then check whether the article provides actual numbers alongside percentages. Look at which periods are being compared. Examine any graphs closely.
Make sure the report does not confuse correlation with causation. Search for missing groups, ambiguity, and alternative interpretations.
Finally, see whether the headline fits the evidence. A story developing quickly does not mean a cautious study should turn into a confident claim.
Final Thoughts
Statistics can be deceptive, but not all are fake. Many are deceptive because they lack context, are cherry-picked, or imply conclusions that the evidence does not support.
University students can recognise these problems without advanced mathematics. Usually, it just takes curiosity, patience, and a few critical questions.
Breaking news rewards speed and emotional effect. Statistical literacy helps readers slow down and see what the numbers are really saying.
Students can improve their judgement by checking sources, samples, comparisons, graphs, and uncertainty. They can also avoid disseminating assertions that seem plausible but are based on flimsy evidence.