How to Manage a Remote Chat Team When Every Reply Is Revenue
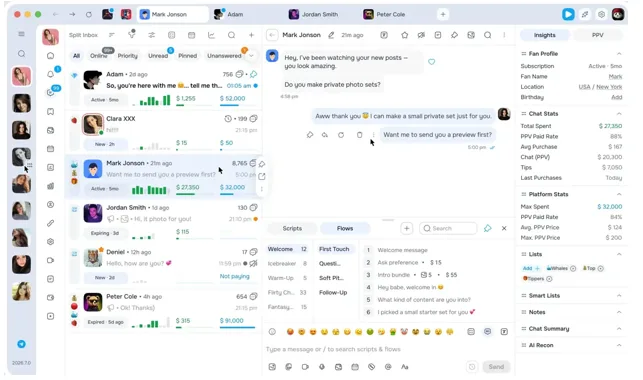
Anyone figuring out how to manage a remote chat team runs into the same wall: you cannot see the work. In an office you notice the operator who spends forty minutes on one conversation. Remotely, you find out at the end of the month, when the numbers are already bad.
The problem is sharpest in creator agencies and subscription-content businesses, where chat operators do not close tickets — they generate revenue directly, message by message. When every reply is a potential sale, a blind spot in management is not an inconvenience. It is a line item.
This piece covers the three systems that make a distributed chat operation manageable:
- A schedule that matches demand instead of clock symmetry.
- Response-time measurement that does not flatter you.
- A short list of KPIs tied to what each person actually earns.
Why chat teams in creator businesses break differently
A conventional support queue has a defined end state: the customer’s problem gets solved and the conversation closes. A monetisation chat team has no end state. The conversation is the product, and the operator’s judgment — when to offer paid content, at what price, to which fan — determines the outcome.
That changes the management problem in two ways:
- Quality is invisible in volume metrics.
- Labour is the dominant cost.
Quality is invisible in volume metrics
An operator who sends 400 messages a shift and undersells every paid offer looks productive and is quietly expensive. On a generic helpdesk dashboard, that operator is a star. On the revenue report, they are a slow leak.
If someone undersells content to farm tips, you want to see it the same day, not at the end of the month — which is exactly what generic helpdesk dashboards will not show you. Chats handled and messages sent are counts; none of them know what a sale looks like.
Labour is the dominant cost
Operators handle most fan interactions, so labour costs scale with message volume. That means every scheduling mistake and every slow shift is paid for twice:
- Once in wages, for hours that produced little.
- Once in missed sales, from conversations that went cold while nobody was covering them.
This double cost is why the rest of this piece treats scheduling, response time and KPIs as one system rather than three separate chores. Each loop feeds the other two.
Shift scheduling for support teams that never close
Fan audiences are global, so demand does not respect your office hours. The naive answer is three equal eight-hour shifts. The correct answer is weighting coverage by when your specific audience spends — which takes measurement, not intuition.
Weight coverage by revenue, not clock symmetry
You only learn when your audience spends by looking at revenue per hour of day for each account — and it is rarely symmetrical. The pattern differs account by account, which is why the analysis has to run per account rather than per agency.
A night shift that produces 40% less revenue than daytime is a signal to act, not a fact of life. The options, roughly in order of preference:
- Redistribute your strongest operators toward the hours that earn.
- Move your highest-earning accounts onto better-covered shifts.
- Only then accept the gap, and staff the weak hours leaner.
Staff the peaks, not the average
One scheduling rule matters more than any software choice. If your average first reply is 45 seconds but your 90th percentile is 4 minutes, customers still feel slow service during peak times. Averages describe the shift; percentiles describe the moments that lose money.
The fix is staffing for the busiest 10–20% of intervals. In practice:
- Pull volume for each hour of each day of the week.
- Rank the intervals and mark the top 10–20%.
- Schedule to those peaks, and let the quiet hours run lean.
The scheduling software layer
For the mechanics of scheduling itself, general workforce tools are cheap and mature. Two are worth naming.
Deputy runs on three tiers, with a $30 monthly floor:
- Lite at $5 per user.
- Core at $6.50 per user, adding auto-scheduling, demand forecasting and wage budgeting.
- Pro at $9 per user.
When I Work is simpler still:
- $2.50 per user for a single location.
- $5 per user for multiple locations.
- Time and attendance built in.
Either handles the basics fine — swaps, no-shows and clock-ins. If you just need shifts covered, the cheaper tool is enough; if you want demand forecasting to run against your revenue-per-hour data, pay for the tier that has it.
What neither can tell you is whether the Tuesday overnight operator made any money. That layer has to come from your chat platform, which is where the KPI sections below take over.
Tracking response time without lying to yourself
Response time is the one metric where remote chat teams drift fastest, because nobody is watching the screen. Drift is gradual — a few slow shifts pass without comment, the baseline moves, and the new normal never gets announced.
The external benchmarks are unforgiving:
- LiveChat’s 2026 customer service report, built from more than 2 billion chats, found a typical first response of 35 seconds.
- Roughly 82% of customers expect a response within 10 minutes.
- Waits above 3–5 minutes correlate with significantly higher abandonment.
Paying fans are less patient than support customers, not more. In a monetised chat, an abandoned conversation is an abandoned purchase, so those thresholds should be read as ceilings rather than targets.
Report the median, not the mean
A small number of extremely delayed conversations can inflate average response time and mask the typical experience. The median tells you what a normal fan actually waited.
Report it per operator, per shift — not per team, per week. Team averages hide exactly the person you need to coach, and weekly rollups hide exactly the shift that needs restaffing.
Check routing balance
One operator juggling six conversations while another handles one means the overloaded operator’s customers wait three times longer. Workload-based routing fixes this.
If your platform routes round-robin, or lets operators pick their own conversations, check the spread by hand until it is fixed. An honest median can still hide a lopsided queue.
Chat team KPIs that survive contact with payroll
Four numbers, tracked per person, are enough to run a remote chat team. More than that and nobody reads the dashboard.
- Revenue per operator per shift. The anchor metric. Everything else on this list exists to explain this one.
- Conversion on paid offers. What percentage of offers sent actually get bought. A falling conversion rate with stable volume means the operator’s approach broke — usually scripts, sometimes targeting.
- Median first response time. Covered above; per operator, per shift.
- Handle time, watched loosely. In conventional live chat, a handle time between 6 and 8 minutes is considered healthy — but in sales chat, long conversations with high spenders are the job. Treat it as a diagnostic, never a target.
The order is the diagnostic path. Revenue says something is wrong; conversion says whether it is a selling problem; response time says whether it is a speed problem; handle time says where the hours went.
The tooling question: four numbers per employee
The tooling question is really a KPI question: can your platform produce these four numbers per employee without a spreadsheet? This is where vertical software earns its keep, and it is worth naming the tools the way operators actually discuss them.
AgencyKey is the one built most directly around per-employee accountability. Its analytics:
- Break out each team member’s monthly revenue, conversion on paid offers and average response time.
- Flag when an individual operator’s conversion drops.
- Surface shift-level revenue gaps.
- Support a team hierarchy up to seven levels — managers, team leads, chatters — with roles and permissions to match.
It also attacks the reading problem that kills remote QA: it reads an entire conversation and distills it into a short summary, even when the chat contains thousands of messages, so a lead can review a shift without scrolling through it.
Infloww is the volume incumbent:
- Over 4,000 agencies use it, particularly teams running high-volume chat operations.
- Billing is a flat $40 per creator profile per month with chatter seats included, though the fee scales with each creator account’s earnings.
- Its per-shift logs record every message, price and dollar per operator.
Supercreator bets on automation instead of headcount:
- Its CRM Lite tier is free to start.
- Its AI runs in assist or full autopilot.
- It takes 5% of AI net sales on top of the fee.
That is a different cost model — one that suits teams trying to shrink the human roster rather than manage it better. Which model fits depends on whether your operators are the asset or the expense.
The mistake that costs the most
The most expensive error in remote chat management is not slow replies. It is compensation design: paying operators a flat percentage of gross revenue with no floor on offer pricing.
It feels aligned. In practice it rewards discounting, and the failure runs on a predictable sequence:
- The fastest way to hit a revenue number is to sell everything cheap to the fans who were going to buy anyway.
- The discounts hit targets, so nobody questions them.
- The damage shows up months later as a trained-down audience that refuses full price.
The defence is boring and works: per-operator conversion and average sale price reviewed weekly, against per-shift logs, with script changes when either slips.
Every tool named above can produce that review. The discipline of holding it is on you.
Running the weekly review
The three systems in this piece collapse into one recurring meeting. Keep it short, keep it per person, and run it against the same reports every week. A workable agenda:
- Revenue per operator per shift, against last week.
- Conversion on paid offers and average sale price — the discount early-warning pair.
- Median first response time per operator per shift, flagged wherever it sits above your own baseline.
- Handle time outliers, read as questions rather than verdicts.
When a number slips, the response is a script change, a routing change or a schedule change — not a lecture. The metrics exist to locate the fix; the following week’s per-shift logs tell you whether it worked.
The takeaway
Managing a remote chat team is three loops run on a weekly cadence:
- Schedule against measured demand instead of clock symmetry.
- Track median response time per operator per shift.
- Review four KPIs per person — revenue, offer conversion, response time, handle time.
The software layer matters mainly in whether it gives you those numbers per employee without manual work. Get the loops running and the distance stops mattering; skip them and no tool will save the operation.