
Long Short Ratio: What It Says About Crypto Traders
By Jack Long
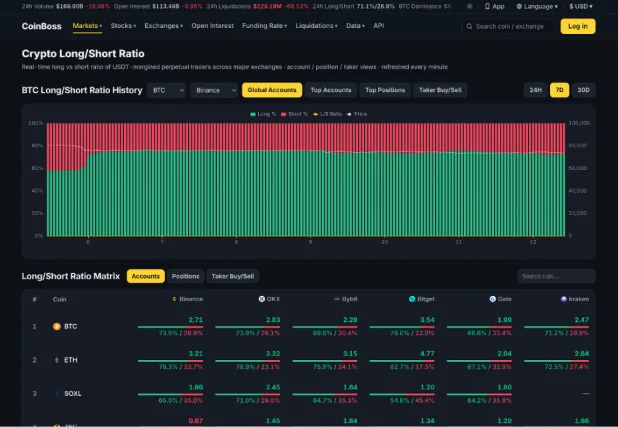
CoinBoss Crypto Long/Short Ratio page, BTC history and exchange matrix, captured 12 Nov 2026 at 10:26 (UTC+8).
Every market has a mood, and in crypto you can put a number on part of it. The long short ratio compares how many traders on a futures exchange are betting on prices going up with how many are betting on them going down. It shows up in trading apps, market commentary and social media posts almost daily. It’s useful, but it’s also one of the most misread figures in the industry, so it pays to know what sits behind it.
What the long short ratio measures
On a derivatives exchange, a long position profits if the price rises and a short profits if it falls. The ratio divides one by the other. A reading of 1 means the two sides are balanced. Above 1, longs outnumber shorts. Below 1, shorts are ahead.
The catch is in the word “outnumber”. Exchanges publish several versions:
- Accounts: the share of user accounts holding a net long versus a net short. Every account counts once, whatever its size.
- Top traders’ accounts or positions: the same split, but only for the largest accounts by margin, sometimes weighted by position size.
- Taker buy/sell: the volume of aggressive market buys against aggressive market sells over a period. This one is about order flow, not open positions.
These versions can disagree sharply. Thousands of small accounts might be long while a handful of large traders hold big shorts. The account-based reading would look bullish, while the money behind it is closer to even.
Reading the bitcoin long short ratio
Bitcoin is the default coin for this data because its futures markets are the deepest. A typical bitcoin long short ratio for retail accounts often sits above 1, since small traders tend to lean long. That alone isn’t a signal. What matters is change and extremes.
On the CoinBoss long short ratio page, you can pick a coin and an exchange, switch between global accounts, top accounts, top positions and taker buy/sell, and view 24-hour, 7-day or 30-day history with the price drawn on top. Below that, a matrix lists the ratio for each coin across Binance, OKX, Bybit, Bitget, Gate and HTX. At time of writing, the screenshot above showed a BTC accounts ratio of 2.71 on Binance, or 73.0% long against 26.9% short. Treat that as a snapshot; the ratio changes every few minutes.
A few practical habits help when you look at it:
- Compare it with its own history. A ratio of 2.7 means little alone. If it was 1.5 last week, the crowd has turned noticeably more bullish.
- Check more than one exchange. Each venue has a different user base. If one exchange is far out of line with the others, that may reflect its customers rather than the market.
- Put accounts and positions side by side. When the account ratio is heavily long but the top-trader position ratio is flat or short, the larger players disagree with the crowd.
Why a crypto long short ratio can mislead
The most common error is reading a high ratio as a buy signal. Often it works the other way. When most traders are already long, there are fewer new buyers left, and those longs become fuel for a sharp drop. A falling price pushes leveraged longs toward forced liquidation, and each forced close adds selling pressure. Crowded shorts can produce the opposite, a fast squeeze higher.
That’s why many traders treat an extreme crypto long short ratio as a contrarian warning rather than a forecast. Even then, extremes can last a long time before anything happens, so the ratio works better as context than as a trigger.
There are other limits too. Exchanges calculate the figure in their own ways, and they don’t publish every detail of the method. Hedged positions can distort the picture: a fund that is long spot bitcoin and short futures looks like a bear in this data, even though it has no view on price. And the ratio says nothing about leverage or position size on its own.
Pairing it with other data
The ratio gets more useful alongside a few other figures. Open interest tells you whether new money is entering futures or leaving. Funding rates show which side is paying to hold its position. Liquidation data shows where crowded trades have already been punished. If the share of bitcoin longs is climbing, open interest is rising and funding is turning expensive, the market is leaning hard in one direction. That’s the kind of setup where a reversal can be violent.
A five-minute routine
When a post claims “everyone is long” or “shorts are piling in”, a short check is enough to test it. Open the BTC chart in the 7-day window and see whether today’s reading is unusual or just normal for that exchange. Switch from accounts to top positions and see whether the larger traders agree. Then glance across the matrix: if the crypto long short ratio is lopsided on one venue but ordinary on the rest, the story is probably about that venue’s users, not the whole market. Finally, look at the price line drawn over the bars. Sentiment that keeps rising while price stalls is often the more interesting detail.
Closing
The long short ratio is a quick read on trader sentiment, nothing more and nothing less. Know which version you’re looking at, compare it with its own history and with other exchanges, and treat extremes as a reason to be careful rather than a reason to follow the crowd. Used that way, the bitcoin long short ratio and the wider crypto long short ratio add real context to a price chart. If you want the ratio alongside open interest, funding and liquidation data, CoinBoss puts them together.
Not financial advice. Trading with leverage carries a high risk of loss.