
America’s Roads Face Holiday Season Pressure as Nearly 300 Million Vehicles Share 4.2 Million Miles of Roads
Key Takeaways
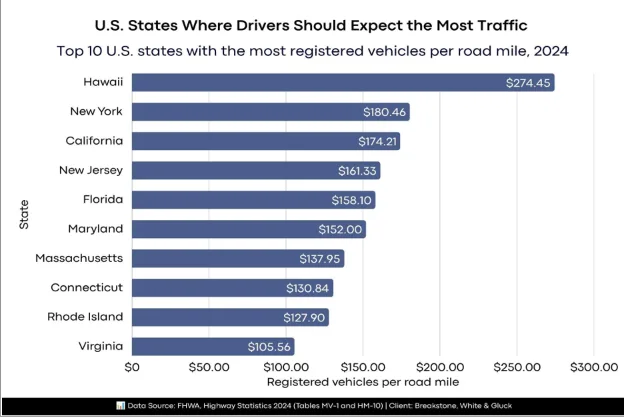
- Highest: Hawaii has the highest vehicle concentration in the U.S., at 274.45 registered vehicles per road mile, followed by New York (180.46), California (174.21), New Jersey (161.33) and Florida (158.10).
- Regional: The Northeast supplies five of the 10 highest-ranked states, and its aggregate of 126.30 registered vehicles per road mile is 2.71 times the Midwest’s 46.55, the lowest of the four Census regions.
- Lowest: North Dakota has the lowest vehicle concentration, at 12.16 registered vehicles per road mile, followed by Kansas (14.44), South Dakota (17.19), Nebraska (20.87) and New Mexico (26.72).
Every holiday season, families load their cars for Thanksgiving dinners, December gatherings and New Year’s celebrations, turning familiar routes into shared ones. Yet the roads they travel are far from equal across the country. In some states, a compact network of highways and streets serves a vast number of vehicles, while in others, long stretches of road cross land where vehicles are comparatively few.
The study, conducted by Breakstone, White & Gluck, divided each state’s 2024 registered motor vehicles, from Federal Highway Administration (FHWA) Table MV-1, by its total public road mileage, from FHWA Table HM-10, and ranked all 50 states by registered vehicles per road mile. The ratio shows how concentrated each state’s vehicle base is relative to its road network; it does not measure traffic volume or forecast congestion.
Table 1: Top 10 U.S. states with the most registered vehicles per road mile, 2024
| Rank | State | Registered vehicles | Total public road miles | Registered vehicles per road mile |
| 1 | Hawaii | 1,270,153 | 4,628 | 274.45 |
| 2 | New York | 20,991,098 | 116,320 | 180.46 |
| 3 | California | 30,940,652 | 177,607 | 174.21 |
| 4 | New Jersey | 6,256,097 | 38,778 | 161.33 |
| 5 | Florida | 19,696,080 | 124,581 | 158.10 |
| 6 | Maryland | 4,965,605 | 32,669 | 152.00 |
| 7 | Massachusetts | 5,094,689 | 36,931 | 137.95 |
| 8 | Connecticut | 2,809,456 | 21,472 | 130.84 |
| 9 | Rhode Island | 838,866 | 6,559 | 127.90 |
| 10 | Virginia | 7,985,530 | 75,649 | 105.56 |
Hawaii’s figure is 3.88 times the national aggregate of 70.65 and 52.08% higher than second-ranked New York. Its lead over New York, 93.99 registered vehicles per road mile, is larger than the entire figure of every state ranked 12th or lower. Hawaii has the smallest public road network of the 50 states, at 4,628 miles. Together, the top 10 hold 33.93% of all registered vehicles on just 15.10% of public road mileage.
Table 2: 10 U.S. states with the fewest registered vehicles per road mile, 2024
| Rank | State | Registered vehicles | Total public road miles | Registered vehicles per road mile |
| 50 | North Dakota | 1,076,690 | 88,565 | 12.16 |
| 49 | Kansas | 2,007,586 | 138,993 | 14.44 |
| 48 | South Dakota | 1,406,923 | 81,825 | 17.19 |
| 47 | Nebraska | 1,989,172 | 95,295 | 20.87 |
| 46 | New Mexico | 1,930,353 | 72,243 | 26.72 |
| 45 | Wyoming | 877,152 | 31,689 | 27.68 |
| 44 | Mississippi | 2,214,249 | 78,398 | 28.24 |
| 43 | Oklahoma | 3,707,717 | 115,560 | 32.08 |
| 42 | Montana | 2,473,269 | 74,705 | 33.11 |
| 41 | Iowa | 3,856,647 | 115,063 | 33.52 |
North Dakota’s figure is 82.79% below the national aggregate, and Hawaii’s is 22.58 times higher. The two states have similar vehicle counts, but North Dakota has 19.14 times Hawaii’s public road mileage. The 10 lowest-ranked states together register 21,539,758 vehicles, fewer than California alone. Five of the 10 are in the Midwest.
Table 3: Registered vehicles per road mile by U.S. Census region, 2024
| Census region | Number of states | Total registered vehicles | Total public road miles | Aggregate registered vehicles per road mile |
| Northeast | 9 | 49,871,317 | 394,850 | 126.30 |
| West | 13 | 69,543,598 | 858,830 | 80.97 |
| South | 16 | 112,654,395 | 1,553,648 | 72.51 |
| Midwest | 12 | 65,153,879 | 1,399,609 | 46.55 |
The Northeast holds 16.78% of the nation’s registered vehicles on just 9.39% of its public road mileage, putting it 78.77% above the national aggregate. The Midwest ranks last at 46.55, 34.11% below the national figure, with no state in the top 10 and five in the bottom 10. The West has the widest spread, home to both first-ranked Hawaii and three bottom-10 states. The South sits closest to the national benchmark, 2.63% above it.
Methodology
Breakstone, White & Gluck calculated registered vehicles per road mile for each of the 50 states by dividing the 2024 “All motor vehicles” registration total in FHWA Table MV-1 by the 2024 total public road length in FHWA Table HM-10, then ranked the states from highest to lowest using unrounded values. The national benchmark of 70.65 is the aggregate ratio of 297,223,189 registered vehicles to 4,206,937 public road miles; regional figures divide each U.S. Census region’s total vehicles by its total road miles, and percentage differences are calculated as (A ÷ B, minus 1) × 100.
Data sources
- Federal Highway Administration, Highway Statistics 2024, Table MV-1: State Motor-Vehicle Registrations: https://www.fhwa.dot.gov/policyinformation/statistics/2024/mv1.cfm
- Federal Highway Administration, Highway Statistics 2024, Table HM-10: Public Road Length: https://www.fhwa.dot.gov/policyinformation/statistics/2024/hm10.cfm
- Research Dataset: https://docs.google.com/spreadsheets/d/1TfrQRWh7o1c1mn0P7G1S8qYuYrwrV698eDZ0l4SHRH0/edit?gid=0#gid=0
- Study by: https://www.bwglaw.com/
About Breakstone, White & Gluck
Breakstone, White & Gluck is a Boston personal injury firm led by founding partners Marc L. Breakstone, David W. White, and Ronald E. Gluck. For more than 30 years, the firm has focused exclusively on injury law, representing Massachusetts clients in accident, product liability, medical malpractice, and wrongful death cases.