From Blossom Counts to Harvest Forecasts: How AI Crop Yield Estimation Is Changing Farm Planning
A grower staring at a flowering orchard in early spring is really staring at a probability distribution. Not every blossom becomes a fruit, not every fruit survives to harvest, and traditional yield forecasting has always meant walking a sample of rows, counting what’s visible, and extrapolating across an entire operation. That approach carries enormous uncertainty into decisions about labor scheduling, storage capacity, and contracts signed months before a single fruit gets picked.
This article traces how computer vision and machine learning have rebuilt that forecasting process from the ground up, starting at the blossom stage and following the crop all the way through to harvest-ready yield numbers. It covers what the published research actually shows about detection accuracy at each growth stage, which model architectures perform best, and where the remaining error margins still sit. Farm managers, agronomists, and ag-tech evaluators should walk away with a grounded sense of what AI-driven yield estimation can deliver today versus what still needs more field validation.
Why Yield Forecasting Has Always Been a Guessing Game
Manual yield estimation methods have relied for decades on sampling a representative section of a field or orchard, counting plants, fruit, or grain heads by hand, and scaling that count up to the full planted area. It’s a reasonable approach in principle, but it inherits every bias present in the sampled patch, and it simply cannot scale to daily or weekly monitoring across thousands of acres. Traditional crop forecasting methods also tend to need substantial lead time and labor, which limits how often a grower can realistically update a forecast as the season progresses.
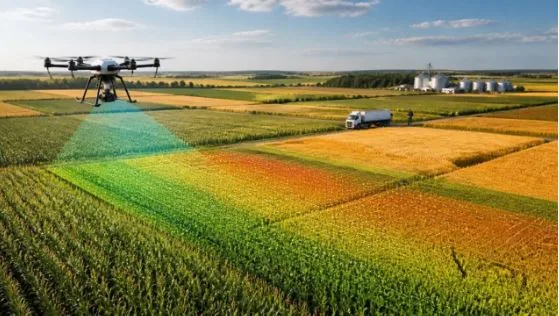
Remote sensing changed the economics of that problem first. Satellite and drone imagery made it possible to observe an entire field’s vegetation health without physically walking it, and vegetation indices calculated from that imagery, most notably the Normalized Difference Vegetation Index, gave researchers a quantitative proxy for crop vigor that correlates with eventual yield. What’s changed more recently is the layer sitting on top of that imagery: machine learning and deep learning models that can turn raw spectral and spatial data into yield numbers with error margins that are shrinking every year.
What the Data Says About Prediction Accuracy
The research literature on machine learning-based yield prediction is large, and the accuracy figures vary depending on crop, region, and how much lead time before harvest a model is trying to forecast. A systematic review covering multiple yield-prediction studies found R² values ranging from 0.5 to 0.96 across different models and crops, with a median of 0.78, and overall accuracy ranging from 51 percent to 99.7 percent depending on methodology, with a median around 92 percent. That spread reflects just how much prediction quality depends on the specific combination of sensor data, crop type, and growth stage being modeled.
Individual studies narrow that picture considerably. One winter wheat yield model using Sentinel-2 and hyperspectral satellite data found that a Long Short-Term Memory network achieved an R² of 0.93, outperforming Random Forest, Gradient Boosting, and Support Vector Regression models tested on the same dataset. A separate corn yield study working with UAV-based remote sensing and soil feature data found Random Forest delivering the lowest prediction error among four tested methods, with an RMSE between 0.52 and 0.58 megagrams per hectare, translating to an error rate of roughly 5 to 6 percent, and found that yield estimation was still feasible as early as the V6 growth stage, well before harvest. Corn yield studies more broadly have reported error rates in the 5 to 8 percent range using ensemble machine learning models paired with aerial imagery.
A broader review focused specifically on deep learning architectures found that convolutional neural network variants consistently outperformed simpler regression-based approaches. Basic linear regression models topped out around 75 to 82 percent accuracy, while advanced architectures like ResNet and U-Net reached 93 to 98 percent accuracy across the studies surveyed, with tree-based ensemble methods such as XGBoost, LightGBM, and CatBoost landing in the 94 to 95 percent range. The consistent pattern across nearly every review is the same: models that can capture non-linear relationships in the data, whether through deep neural networks or gradient-boosted trees, reliably beat simpler statistical baselines.
Fusing Drones, Satellites, and Soil Data
No single data source tells the whole story on its own, which is why the strongest-performing systems combine multiple inputs rather than relying on satellite imagery or drone footage in isolation. One study integrating UAV and satellite data with machine learning models reported a yield prediction accuracy of R² equals 0.83, alongside a reduction in irrigation costs of 20 to 25 percent and nitrogen application reductions of up to 31 kilograms per hectare, all without sacrificing productivity. That same research found AI-driven disease detection integrated into the same pipeline achieved 81 to 95 percent accuracy in identifying crop infections two to three weeks before visible symptoms appeared, adding another layer of early-warning value beyond yield numbers alone.
Satellite resolution itself makes a measurable difference. A wheat yield comparison found that estimates based on 10-meter resolution Sentinel-2 imagery were more accurate than estimates from 30-meter ZY-1 02D hyperspectral data, which in turn outperformed lower-resolution 30-meter Sentinel-2 data, producing R² values of 0.91, 0.93, and lower respectively depending on the exact data combination used. Combining Sentinel-2 data with stepwise multilinear models and random forest classification in a separate wheat study achieved an R² of 0.83 and 86 percent overall mapping accuracy prior to harvest, a meaningful improvement over traditional Landsat-plus-NDVI approaches that typically only reach R² values between 0.5 and 0.65.
Timing also affects how useful a prediction actually is to a grower. One rice and wheat yield study found its best-performing model could generate estimates six to eight weeks before harvest with an R² of 0.75 for wheat and 0.68 for rice, giving growers a meaningful planning window rather than a number that only confirms what’s already happened in the field.
Counting Blossoms Before They Become Fruit
Grain and row-crop yield modeling relies heavily on vegetation indices and canopy-level spectral data, but orchard and fruit-crop yield estimation works differently, often starting at the flower stage itself. Detecting and counting blossoms early in the season gives growers a leading indicator of eventual fruit load, months before harvest, and recent computer vision research has pushed that capability further than manual counting ever could.
One study using a lightweight U-Net variant for apple blossom detection, trained on a dataset of 3,200 handheld RGB images, achieved an R² of 0.80 while processing each image in just 14.2 milliseconds, fast enough for near real-time field use. Litchi orchard research took a different technical route, using a YOLACT++ instance segmentation model to separate individual flower clusters from background canopy, then applying density map regression through an algorithm called FlowrNet to produce accurate inflorescence counts. Both approaches point toward the same underlying strategy: segment the flowering structures first, then count them with a model trained specifically for that density-estimation task rather than a generic object detector.
From Fruit Detection to Final Harvest Numbers
Once fruit has set, the detection and counting problem shifts again, and a substantial body of orchard research has tackled it crop by crop. A chestnut counting study using YOLOv4 reached an R² of 0.98 against manual counts, describing itself as achieving high-precision fruit counting on tree canopies. Citrus detection research combining LiDAR-based tree segmentation with CNN-based fruit recognition achieved an average precision of 0.957 for detection and a mean absolute error of just 0.081 for counting. Pitaya yield estimation using UAV RGB imagery across different growth scenarios reported an accuracy of 93.28 percent.
Apple orchards have received some of the most extensive comparative research in this space. One comparative study testing multiple fruit detection and counting methods head-to-head found that a semi-supervised Gaussian Mixture Model approach actually outperformed deep learning methods for the detection step alone, but that deep learning consistently performed better for the counting step across every dataset tested. Combining the two techniques, semi-supervised detection paired with deep learning-based counting, produced yield estimation accuracies ranging from 95.56 to 97.83 percent. Earlier automated apple orchard yield systems using computer vision reported even tighter error margins in field trials, with a red apple block estimation error of negative 3.2 percent and a green apple block error of just 1.2 percent, figures that held up despite the additional challenge of foliage occlusion in the green apple block.
Video-based tracking systems add a temporal dimension that single-image counting can’t capture, following fruit across multiple frames to avoid double-counting or missed detections caused by occlusion. One YOLOv5x and ByteTrack-based tracking system evaluated on real orchard footage reported a mean absolute percentage error of 7.47 percent and an R² of 0.70, with accuracy improving as the measurement date moved closer to actual harvest, when fruit size and visibility increase.
Where the Error Still Creeps In
Every one of these systems shares the same core vulnerability: occlusion. Fruit and flowers hidden behind leaves, branches, or other fruit clusters get missed or double-counted, and every study that reports strong headline accuracy also reports degraded performance under heavy occlusion or variable lighting conditions. One deep learning fruit yield model noted that false positives concentrated specifically around sunlight variation and immature fruit that hadn’t yet developed distinguishing visual features, even while the overall system achieved more than 90 percent precision and an F1 score above 89 percent.
Fruit diameter and color estimates behave somewhat better under these same conditions. One multi-crop study found fruit number prediction accuracy exceeding 90 percent across all tested crops and training systems, while fruit diameter predictions carried percent standard errors under 10 percent and root mean square errors under 5 millimeters regardless of row spacing or canopy position, suggesting that size and color measurements are less sensitive to the occlusion problems that plague raw fruit counting.
The practical takeaway for anyone evaluating these systems is that headline accuracy numbers need context. A 95 percent counting accuracy achieved under controlled canopy conditions with minimal occlusion won’t automatically transfer to a densely planted, heavily shaded orchard block, and growers should expect calibration and localized validation to matter as much as the underlying model architecture.
The Bottom Line for Farm Planning
The shift from manual sampling to AI-driven yield estimation isn’t just a technical upgrade, it changes what decisions become possible months earlier than before. Blossom-stage detection models running at millisecond processing speeds give growers an early read on fruit load before a single fruit has formed. Mid-season row-crop models built on Random Forest, LSTM, or gradient-boosted architectures can forecast grain yield six to eight weeks ahead of harvest with R² values regularly clearing 0.8, and sometimes exceeding 0.9 when paired with high-resolution satellite data. Orchard-specific counting systems combining detection and tracking algorithms have pushed fruit-count accuracy into the mid-to-high 90 percent range under favorable canopy conditions.
None of these systems eliminate uncertainty entirely, and occlusion, lighting variability, and crop-specific canopy structure remain the biggest sources of residual error across the literature. What they do provide is a forecasting process that updates continuously through the season rather than relying on a single manual sample taken at one point in time, giving farm managers a materially better basis for decisions on labor, storage, and marketing long before the harvest itself confirms whether those decisions were right.