Hawaii, Alaska, New Hampshire, Wyoming Are America’s Safest Train Routes
Your Next Rail Journey Could Be Perfectly Safe or Maximum Risk – And It All Depends on Which States You’re Traveling Through
You’re settling into your seat on a cross-country train, laptop open, coffee steaming, watching scenic landscapes roll past your window. Trains feel safer than driving – but what if the state you’re traveling through has a rail danger score 100 times higher than Hawaii’s? What if that route passes through crossings where dozens die annually, or areas where trespasser fatalities have become grim statistics?
For families planning rail vacations or commuters choosing trains over driving, the difference between boarding in Hawaii versus Montana could mean the difference between a safe journey and a deadly one.
The research conducted by Steve Gimblin Personal Injury & Car Accident Lawyers analyzed rail fatalities across U.S. states from 2019 to 2023. It measured three primary metrics: Average Rail Fatalities per 100,000 residents (scored out of 50 points), Average Rail Fatalities at Highway Crossings per 100,000 residents (scored out of 20 points), and Average Rail Fatalities Involving Trespassers per 100,000 residents (scored out of 30 points). These metrics were totaled to rank the states based on the highest to lowest danger score on a 100-point scale, with higher scores indicating greater rail safety risks and lower scores indicating lower risks.
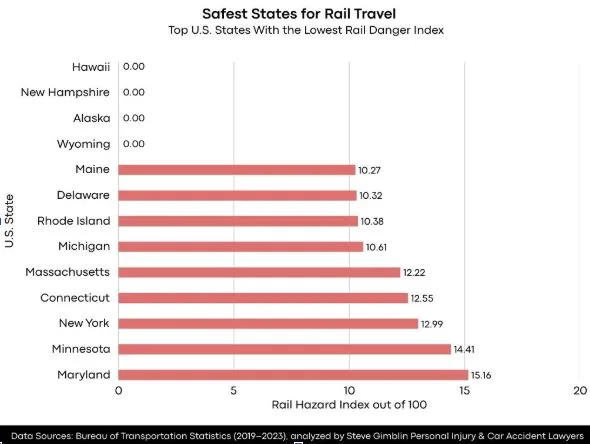
Between 2019 and 2023, Hawaii, New Hampshire, Alaska, and Wyoming achieved perfect safety records with a rail hazard score of 0/100 – meaning zero rail fatalities across all categories during this five-year period. These states represent the gold standard for rail safety in America.
But the contrast couldn’t be more stark.
Maine ranks second with a rail hazard score of 10.27/100. The Pine Tree State has a population of 1,372,408 and averaged 2 rail fatalities annually between 2019 and 2023. The state recorded 0.12 average rail fatalities per 100,000 residents (scoring 5/50 for overall fatalities), 0 fatalities at highway crossings per 100,000 residents (scoring 0/20 for crossing incidents), and 0.07 fatalities involving trespassers per 100,000 residents (scoring 5/30 for trespasser incidents).
Delaware rounds up the top 3 with a rail hazard score of 10.32/100. The First State has a population of 1,003,859 and averaged 1 rail fatality annually between 2019 and 2023. The state recorded 0.08 average rail fatalities per 100,000 residents (scoring 4/50 for overall fatalities), 0 fatalities at highway crossings per 100,000 residents (scoring 0/20 for crossing incidents), and 0.10 fatalities involving trespassers per 100,000 residents (scoring 7/30 for trespasser incidents).
Looking at the study, a spokesperson from Steve Gimblin Personal & Car Accident Lawyers commented:
“The research reveals that Hawaii, New Hampshire, and Alaska face the lowest rail safety risks, with all three states showing zero fatalities across all categories. These states stand in stark contrast to areas reporting high per capita fatality rates and frequent crossing or trespasser-related incidents.
“The data further suggests that states with consistently low or zero rail fatality rates tend to create safer environments for both passengers and pedestrians compared to those with higher incident volumes. To maintain strong rail safety outcomes, states should continue prioritizing infrastructure upgrades, trespasser prevention programs, and public education campaigns to reduce the likelihood of future rail-related incidents.”
The Warning Signs Every Rail Traveler Should Know: A Passenger’s Safety Guide
Here’s your action plan before your next train journey:
Before You Book Your Ticket: Research Routes, Not Just Destinations
- Check whether your route passes through high-risk states identified in this study
- Review the Federal Railroad Administration’s crossing safety database for your planned route
- Consider alternative routes through safer states for long-distance travel
- Download the FRA’s crossing safety app to identify dangerous crossings near your destination
The Station Safety Assessment
- Arrive early to observe station safety protocols and crossing gate functionality
- Note emergency contact information and railroad police numbers
- Identify platform emergency exits and evacuation routes
- Stay behind the yellow safety lines and never cross tracks except at designated crossings
During Your Journey
- Remain seated when the train is in motion, especially near highway crossings
- Never walk between cars while the train is moving
- Keep belongings secure to avoid chasing items near tracks during stops
- If you witness unsafe behavior (trespassing, crossing violations), report to train crew immediately
Top 10 Safest States for Rail Travel
- Hawaii – 0/100 Rail Hazard Index
- New Hampshire – 0/100 Rail Hazard Index
- Alaska – 0/100 Rail Hazard Index
- Wyoming – 0/100 Rail Hazard Index
- Maine – 10.27/100 Rail Hazard Index
- Delaware – 10.32/100 Rail Hazard Index
- Rhode Island – 10.38/100 Rail Hazard Index
- Michigan – 10.61/100 Rail Hazard Index
- Massachusetts – 12.22/100 Rail Hazard Index
- Connecticut – 12.55/100 Rail Hazard Index
The Most Dangerous Reality
On the opposite end of the spectrum, Montana emerged as America’s most dangerous state for rail travel, reporting a catastrophic rail hazard score of 100/100 – representing the maximum danger level on the index and indicating severe rail safety challenges across all measured categories.
Table of Extended Results:
| Top U.S. States With the Lowest Rail Danger Index | ||
| U.S. States | Rail Hazard Index out of 100 | Rank |
| Hawaii | 0 | 1 |
| New Hampshire | 0 | 1 |
| Alaska | 0 | 1 |
| Wyoming | 0 | 1 |
| Maine | 10.27 | 2 |
| Delaware | 10.32 | 3 |
| Rhode Island | 10.38 | 4 |
| Michigan | 10.61 | 5 |
| Massachusetts | 12.22 | 6 |
| Connecticut | 12.55 | 7 |
| New York | 12.99 | 8 |
| Minnesota | 14.41 | 9 |
| Maryland | 15.16 | 10 |
The study was conducted by Steve Gimblin Personal Injury & Car Accident Lawyers, a California-based law firm representing victims of car, truck, and motorcycle accidents. Led by experienced attorney Steve Gimblin, the firm helps injured clients navigate complex insurance claims and legal battles to secure the compensation and justice they deserve.
Methodology
The study analyzed rail safety data across U.S. states from 2019 to 2023. It measured three primary metrics: Average Rail Fatalities per 100,000 residents (scored out of 50 points), Average Rail Fatalities at Highway Crossings per 100,000 residents (scored out of 20 points), and Average Rail Fatalities Involving Trespassers per 100,000 residents (scored out of 30 points). These metrics were totaled to rank the states based on the highest to lowest danger score on a 100-point scale, with higher scores indicating greater rail safety risks and lower scores indicating lower risks.
Data Sources
- Bureau of Transportation Statistics: https://www.bts.gov/browse-statistical-products-and-data/state-transportation-statistics/transportation-safety
- Research Dataset: https://docs.google.com/spreadsheets/d/1y9gPn0RVYZaS7J7hmd869_dKe7yiTDtuIDVRuokoZ90/edit?gid=0#gid=0
- Study by: https://yubalaw.com/