How Cities Are Using POI Data to Find the Gaps a Map Can’t Show You
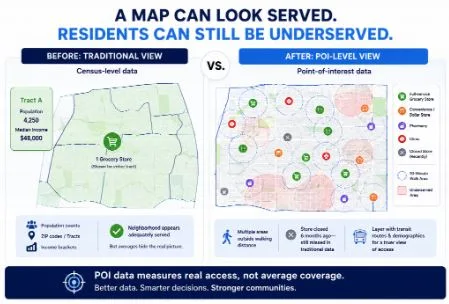
A city can look fully served on paper, and still leave whole neighborhoods without a grocery store, a pharmacy, or a clinic anywhere close by. Census tracts and zip codes give you population counts and income brackets, sure. What they don’t give you is what’s actually sitting on that block right now. That’s the gap point-of-interest (POI) data is starting to close.
Food Deserts Are a Location Problem First
Food deserts aren’t really about food, if you think about it. They’re about distance. About whether you can get somewhere on foot, or whether you need a car you don’t have. Researchers have leaned on simple rules of thumb for years, like flagging a zone if there’s no full-service grocery store within a 10-minute walk. But this kind of census-level view runs into a resolution problem pretty quickly. It can tell you a tract is underserved on average, but not which blocks are actually cut off, which corridors never had a real option to begin with, or that a store closed down six months ago and nobody’s updated the picture since.
Address-level POI data is what actually fixes that problem. Rather than guessing at access from population density and rough store counts, planners can now look at every individual grocery store, supermarket, pharmacy, and dollar store in an area, right down to its category, its hours, and whether it’s a full-service outlet or just a convenience spot stocked mostly with packaged goods. Layer in transit routes and demographic data on top of that, and the picture stops being a vague estimate. It becomes something much closer to the truth, a street-by-street read on who can actually reach fresh food and who genuinely can’t.
Service Gaps Go Beyond Groceries
The same logic holds for a lot more than food. Cities and researchers are applying it to healthcare, banking, childcare, you name it. And the pattern keeps repeating itself: a neighborhood can look “covered” just by counting how many locations are nearby, while still missing the one thing people actually need. Maybe there are five clinics in the area, but not one of them stays open past 5pm. Maybe there are plenty of banks, just none within walking distance of the housing that needs them most. This is exactly why POI-level detail matters, categorized by what a place actually does rather than the broad label it falls under. That’s what exposes gaps like these instead of quietly papering over them.
This kind of analysis has already shaped real decisions. Health systems evaluating where to open urgent care centers have used point-of-interest patterns, not just population counts, to find areas that looked served on the surface but had limited or lower-quality options nearby. Retailers and public agencies map complementary and competing businesses the same way to spot both business opportunity and community need in the same dataset.
Why It Works: Granularity, Categorization, and Change Over Time
Three things make POI data useful for this kind of work:
- Granularity
Individual business locations, not neighborhood averages, are what reveal which specific blocks are underserved. - Categorization
Knowing that a location is a “grocery store” isn’t enough. Whether it’s full-service or limited-assortment, its hours, and its accessibility all shape whether it actually closes a gap. - Change over time
Store openings and closures happen constantly. A food desert map built on year-old data can miss a new closure that just created one, or a new store that just fixed one.
The Outcome Depends on the Input
None of this works if the underlying data is stale or inconsistent. A grocery store that closed two months ago but still appears “open” in a dataset doesn’t just create a rounding error, it can send an intervention, a mobile market route, or a delivery pilot to the wrong place entirely. Given how directly this kind of analysis feeds into resource allocation and public planning, the quality and freshness of the POI data behind it deserves the same scrutiny as the analysis itself.
That’s the standard we hold ourselves to at SafeGraph. Our POI data is refreshed monthly, precisely because store openings, closures, and changes happen too fast for anything less frequent to stay trustworthy for the kind of decisions communities are relying on it for.