Indiana Is Safest for School Buses, Hawaii Ranks Worst:
Key Highlights
|
Every morning, millions of children step onto a yellow school bus trusting they will get home safely. Most do, but not equally. With 57,000 crashes a year, some ride in states where systems protect them, while others face roads, policies, and oversight that fail them. This is not a chance. It is a choice.
The study by Grigor Law Injury & Car Accident Lawyers analyzed federal crash data from 2019 to 2023 and student transportation volumes from 2021 to 2024 across all 50 states. The study creates a 100-point School Bus Driving Risk Score combining crash frequency at 70% weight and road infrastructure quality at 30% weight.
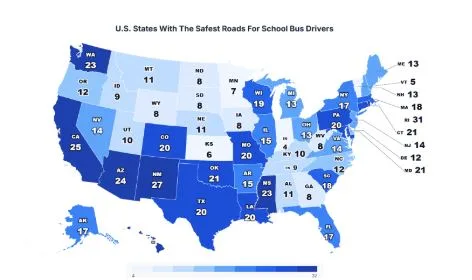
States Achieving Lowest Overall Safety Risk Scores
| Rank | State | Overall Risk Score | Crashes per 100,000 Students | % Unacceptable Roads |
|---|---|---|---|---|
| 1 | Indiana | 4 | 199.8 | 2.62% |
| 2 | Vermont | 5 | 140.0 | 5.15% |
| 3 | Kansas | 6 | 294.6 | 3.81% |
| 4 | Minnesota | 7 | 87.2 | 9.46% |
| 5 | Georgia | 8 | 285.3 | 6.49% |
| 6 | West Virginia | 8 | 211.0 | 8.25% |
| 7 | Wyoming | 8 | 389.3 | 5.12% |
| 8 | South Dakota | 8 | 403.4 | 4.90% |
| 9 | North Dakota | 8 | 322.6 | 6.67% |
| 10 | Iowa | 8 | 223.9 | 8.74% |
Indiana achieves the safest environment by combining moderate crash rates with exceptional infrastructure quality at only 2.62% unacceptable roads. Upper Midwest states dominate safety rankings with four positions in the top ten, demonstrating consistent operational excellence across the region.
Looking at the study, Chrissy Grigoropoulos, founder of Grigor Law Injury & Car Accident Lawyers, commented:
“The more than ten-fold crash rate difference across states reflects deliberate policy choices about driver training, road maintenance, and operational oversight. When children’s safety varies dramatically by geography, states must prioritize infrastructure investment and enhanced safety protocols to protect our most vulnerable commuters.”
States Recording Highest Crash Frequencies Per Student Population
| Rank | State | Crashes per 100,000 Students | Annual Crashes | Students Transported Daily |
|---|---|---|---|---|
| 1 | Florida | 747.9 | 5,071.6 | 678,123 |
| 2 | Arizona | 555.8 | 1,673.6 | 301,135 |
| 3 | California | 529.2 | 5,821.6 | 1,100,000 |
| 4 | Hawaii | 505.5 | 134.0 | 26,511 |
| 5 | Nebraska | 505.1 | 336.8 | 66,681 |
| 6 | South Carolina | 458.9 | 1,514.4 | 330,000 |
| 7 | New Mexico | 433.3 | 604.4 | 139,477 |
| 8 | Alabama | 416.1 | 1,358.0 | 326,331 |
| 9 | South Dakota | 403.4 | 177.0 | 43,876 |
| 10 | Wyoming | 389.3 | 168.4 | 43,255 |
Florida records the nation’s highest crash rate at 747.9 per 100,000 students, representing systematic operational failures compared to safer states. New York achieves the lowest rate at 70.9 despite operating the largest system with 2,087,748 daily riders, proving scale does not determine safety outcomes.
States With Highest Percentage of Deteriorating Road Infrastructure
| Rank | State | % Unacceptable Roads | Infrastructure Score | Overall Risk Score |
|---|---|---|---|---|
| 1 | Rhode Island | 44.75% | 30 | 31 |
| 2 | Hawaii | 39.09% | 26 | 32 |
| 3 | New Mexico | 32.97% | 22 | 27 |
| 4 | Connecticut | 29.97% | 20 | 21 |
| 5 | Mississippi | 29.85% | 20 | 23 |
| 6 | Washington | 29.63% | 20 | 23 |
| 7 | Maryland | 28.72% | 19 | 21 |
| 8 | California | 28.04% | 19 | 25 |
| 9 | Pennsylvania | 27.37% | 18 | 20 |
| 10 | Oklahoma | 26.88% | 18 | 21 |
Rhode Island confronts the nation’s worst infrastructure crisis with 44.75% of roads rated unacceptable, creating hazardous conditions for 94,800 daily student riders. Indiana maintains excellence with only 2.62% unacceptable roads, demonstrating a seventeen-fold difference in quality that directly impacts student safety.
Largest Student Transportation Systems by Daily Ridership Volume
| Rank | State | Students Transported Daily | Annual Crashes | Crashes per 100,000 Students | Overall Risk Score |
|---|---|---|---|---|---|
| 1 | New York | 2,087,748 | 1,481.2 | 70.9 | 17 |
| 2 | Texas | 1,548,374 | 5,941.4 | 383.7 | 20 |
| 3 | Pennsylvania | 1,412,379 | 1,677.2 | 118.7 | 20 |
| 4 | California | 1,100,000 | 5,821.6 | 529.2 | 25 |
| 5 | Illinois | 976,971 | 1,743.4 | 178.4 | 15 |
New York operates America’s largest school transportation system while achieving the lowest crash rate nationally at 70.9 per 100,000 students. Texas and California collectively account for 11,763.0 annual crashes and demonstrate vastly different safety profiles, highlighting that system size alone does not guarantee safety outcomes. New York’s record proves that large-scale operations can achieve safety excellence through enhanced driver training and robust oversight.
Regional Performance Analysis Showing Consistent Safety Excellence
| Rank | State | Region | Crashes per 100,000 Students | % Unacceptable Roads | Overall Risk Score |
|---|---|---|---|---|---|
| 1 | Minnesota | Upper Midwest | 87.2 | 9.46% | 7 |
| 2 | Indiana | Upper Midwest | 199.8 | 2.62% | 4 |
| 3 | Iowa | Upper Midwest | 223.9 | 8.74% | 8 |
| 4 | North Dakota | Upper Midwest | 322.6 | 6.67% | 8 |
| 5 | Kansas | Great Plains | 294.6 | 3.81% | 6 |
The Upper Midwest demonstrates exceptional regional consistency, claiming four of the nation’s safest transportation environments through sustained infrastructure investment. Minnesota achieves the second-lowest crash rate at 87.2 per 100,000 students while managing 682,039 daily riders across diverse terrain.
States Recording Highest Combined Risk Scores Nationally
| Rank | State | Overall Risk Score | Crashes per 100,000 Students | % Unacceptable Roads |
|---|---|---|---|---|
| 50 | Hawaii | 32 | 505.5 | 39.09% |
| 49 | Rhode Island | 31 | 88.6 | 44.75% |
| 48 | New Mexico | 27 | 433.3 | 32.97% |
| 47 | California | 25 | 529.2 | 28.04% |
| 46 | Arizona | 24 | 555.8 | 25.75% |
Hawaii ranks as the most dangerous state with risk score 32, combining high crash frequency at 505.5 per 100,000 students with severely deteriorated infrastructure. Rhode Island follows with the nation’s worst pavement quality at 44.75% unacceptable, creating compounded safety threats for daily riders.
Methodology
This analysis examined federal crash data from 2019 to 2023 and student transportation volumes from 2021 to 2024 to calculate standardized crash rates per 100,000 students transported daily. The School Bus Driving Risk Score ranges from 0 to 100, combining crash frequency at 70% weight and road infrastructure quality at 30% weight, where lower scores indicate safer conditions. Rankings reflect overall safety performance, with Rank 1 representing the safest state and Rank 50 the most dangerous environment.
Data Sources
- Crash Data: National Highway Traffic Safety Administration FARS
- Road Conditions: Bureau of Transportation Statistics
https://www.bts.gov/road-condition
- Student Transportation: School Bus Fleet Magazine
https://www.schoolbusfleet.com/download?id=10233821
- Population Data: U.S. Census Bureau
https://www.census.gov/programs-surveys/popest.html
- Research Dataset:
https://docs.google.com/spreadsheets/d/1X53XsHSVYdBC2p78X44HwVu60gwyFxGfJ4qILFGIkRY/edit?usp=sharing
- Study by:
About Grigor Law Injury & Car Accident Lawyers
Grigor Law Injury & Car Accident Lawyers serves as New York’s premier all-injury law firm, representing clients in motor vehicle accidents and personal injury cases. The firm conducts data-driven research into traffic safety and infrastructure conditions to inform public policy discussions and promote enhanced safety standards.