MakeInfographic.ai Review: Can It Really Turn Text Into Infographics in Seconds for free?
Creating a strong infographic usually sounds easier than it really is. In theory, you just organize a few ideas, add some icons, choose colors, and arrange everything into a clean visual. In practice, the work often turns into a slow chain of layout decisions, design tweaks, and template cleanup. You may start with a simple concept, but then spend far too much time resizing blocks, fixing spacing, rewriting labels, and trying to make the whole thing feel polished.
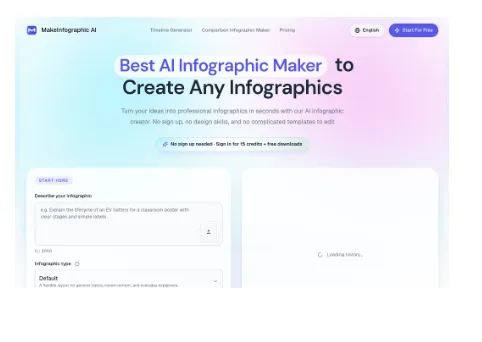
That is why tools like MakeInfographic.ai are interesting. Instead of beginning with a blank canvas or a dense editor full of menus, the product promises a much lower-friction workflow: type what you want, choose a structure and style, and get an infographic draft quickly. The homepage positioning is very clear about that promise. It emphasizes free access, no sign up, instant results, and no complicated templates to edit.
For people who want to turn ideas into visual content fast, that positioning is appealing. But a good homepage promise is not enough. The real question is whether the product actually feels useful once you look at what it offers, how it frames its workflow, and what kind of user it seems built for.
In this Make Infographic AI review, the short answer is yes: the product looks genuinely strong for people who care more about speed, structure, and usable first drafts than about manually designing every element from scratch. It is not a replacement for every advanced design workflow, and there are some clear limits around watermark customization and premium exports. But as a fast AI infographic generator, it has a lot going for it.
What MakeInfographic.ai is trying to do
Make Infographic ai is built around a simple promise: help people create infographic-style visuals from text prompts without the usual design overhead. The homepage message is unusually focused and easy to understand. It does not try to overwhelm the user with an enterprise dashboard story. Instead, it leans on four practical ideas:
– you do not need to sign up before trying it
– you do not need professional design skills
– you do not need to wrestle with complex templates first
– you can still edit and refine the output after generation
That combination matters. Many AI design tools are strong at generation but weak at practical workflow. Others are rich in editing features but still feel like traditional design software with an AI layer added on top. MakeInfographic.ai seems to sit in a more useful middle ground. It wants the first draft to appear quickly, but it also wants the output to remain editable enough to become publishable.
Why the workflow feels lower-friction than typical design tools
MakeInfographic.ai’s main advantage is not just AI. It is designed to reduce the friction of getting started.
As a free infographic maker, the first thing users see is a prompt field labeled “Describe your infographic.” Right below it, the site shows the key controls needed for a practical workflow:
– infographic type
– visual style
– ratio
– resolution
– watermark text
That is a smart setup. Instead of forcing users into a large editor first, it asks for the key decisions up front. It also immediately suggests that the tool understands infographic generation as a structured task, not just a generic image prompt.
For many users, that is the real value. If you are a marketer, teacher, creator, consultant, or student, you often already know the shape of the information you want to explain. What slows you down is not having ideas. It is converting those ideas into a readable visual. MakeInfographic.ai appears built to close that gap quickly.
Website Preview
One of its strongest advantages: structure first, not canvas first
A lot of design platforms start from the assumption that you want to manually build your composition. MakeInfographic.ai takes a different direction. The product repeatedly emphasizes infographic types and formats such as:
– timelines
– comparisons
– processes
– pyramids
– dashboards
– roadmaps
– explainers
– decision trees
– statistical layouts
This is more important than it may sound.
Infographics work best when the structure fits the message. A timeline should feel chronological. A comparison should make tradeoffs obvious. A process graphic should guide the eye step by step. If a tool helps the user choose the right structure from the beginning, it saves time and usually improves clarity.
That is one reason MakeInfographic.ai stands out. It is not just selling “AI art for charts.” It is selling an AI infographic creator that appears to understand common information layouts from the start.
Speed is a real part of the value proposition
The language on the site, like “instant results” and “in seconds,” clearly signals speed, which matches what the product is built to optimize.
That said, it should not be framed as a hard promise for every prompt. Like any AI timeline generator, output time depends on complexity, queue load, and generation settings. For simpler briefs, though, the workflow is designed to feel much faster than the traditional infographic process.
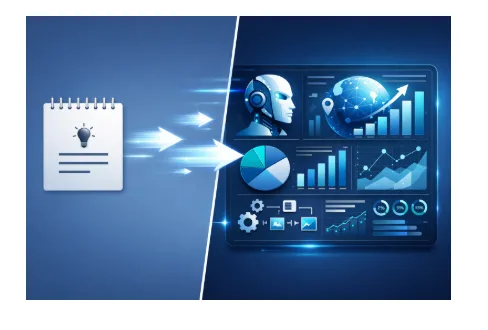
This matters because the biggest bottleneck in infographic work is usually the first draft. When a usable draft appears quickly, users can move from creating from scratch to editing toward a publishable result.
A good way to describe the benefit is this: MakeInfographic.ai shortens the distance between idea and visual starting point. For many people, that is more valuable than having a huge list of manual design controls.
Speed Workflow Illustration
Editing is not an afterthought here
Another strong point is that the product does not stop at generation. The site explicitly says users can download instantly or keep editing the result, and that they can refine sections until the design is ready to publish.
This is one of the most practical things in the entire product message.
AI generation is rarely perfect on the first pass. Labels can be slightly off. Emphasis can be uneven. A section may need clearer wording. Layout balance may need adjustment. If a product only generates but does not make refinement easy, the user still ends up stuck.
MakeInfographic.ai appears to understand that. It is not trying to pretend AI removes the need for iteration. Instead, it frames itself as a fast way to get to a solid draft and then improve it. That is a much more believable and useful story.
For content creators, teachers, marketers, and internal teams, that combination is ideal. They usually do not want endless blank-canvas freedom. They want a good first version quickly, then enough control to make it usable.
Where MakeInfographic.ai looks especially strong
### 1. Social and content creation use cases
The homepage explicitly connects the tool to X, TikTok, Pinterest, Instagram, Facebook, and LinkedIn. That is a smart positioning move because these audiences often need repeatable visual content, not one perfect poster made over three days.
The ability to adapt one topic into multiple visual angles is especially useful for creators and marketers. It suggests the tool can serve as both a design shortcut and a content ideation engine.
### 2. Education and training
Teachers, students, and trainers are all called out on the site. That makes sense. Educational infographic work is highly structured, often repetitive, and usually time-constrained. A tool that can turn lesson content, notes, or process steps into readable layouts quickly is genuinely helpful in that context.
### 3. Business communication
Consultants, researchers, HR teams, and marketers all benefit from fast clarity. Many internal and client-facing visuals do not need award-winning design. They need to explain something clearly, quickly, and with enough polish to be shareable. MakeInfographic.ai seems well aligned with that need.
Quick feature summary table
| Workflow area | MakeInfographic.ai | Traditional template-first workflow |
| Starting friction | Very low, with no-sign-up entry and prompt-led setup | Usually higher, because you start inside an editor or template library |
| First draft speed | Designed for quick prompt-to-visual output | Often slower because layout decisions start immediately |
| Structured infographic types | Strong emphasis on timelines, comparisons, processes, pyramids, and explainers | Possible, but often requires more manual arrangement |
| Editing after generation | Yes, positioned as part of the workflow | Yes, but usually with more manual work from the beginning |
| Watermark flexibility | Custom watermark is Pro-only | Depends on platform and export plan |
| Premium exports | 4K export reserved for subscribers | Often tied to paid tiers as well |
What the product still does not hide
To its credit, MakeInfographic.ai is not presented as unlimited or fully premium at the free level.
The site makes several constraints visible:
– 4K export is reserved for active subscribers
– watermark customization is Pro
– free users generate with the default MakeInfographic.ai watermark
– resolution tiers are tied to credits
That transparency is actually a good sign. It tells the user what kind of experience to expect before they get too deep into the workflow.
From a review perspective, these are real limitations, but they are reasonable ones. None of them undermines the main advantage of the product, which is fast structured generation. They simply define where the free workflow ends and where paid convenience begins.
Editing Workflow Illustration

Who should use MakeInfographic.ai
MakeInfographic.ai looks best for people who value speed, structure, and usable drafts over pixel-perfect manual control from the very first step.
It is especially well suited to:
– creators who need visual content quickly
– teachers and students building educational explainers
– marketers turning ideas into campaign visuals
– consultants packaging comparisons and frameworks
– internal teams creating policy, process, or onboarding diagrams
If your main goal is to start from a blank canvas and obsess over every visual detail, you may still prefer a heavier design environment. But if your goal is to create a solid infographic fast, then refine it, MakeInfographic.ai has a much stronger case.
Final Conclusion
So, can MakeInfographic.ai really turn text into infographics in seconds? In the most useful sense, yes. The product clearly focuses on fast first-pass generation, structured infographic types, and minimal startup friction. That alone makes it appealing.
What makes it more convincing, though, is that the workflow does not stop at generation. The site consistently reinforces the idea that users can continue editing, refining, and adapting their output after the AI has done the heavy lifting. That gives the tool more credibility than products that rely purely on one-click magic.
The biggest strengths are easy to summarize:
– no-sign-up entry lowers friction immediately
– structured infographic formats make the output more practical
– fast first-draft positioning fits real-world content needs
– editing support makes the tool more useful after generation
– broad audience fit extends from creators to educators to business users
The main trade-offs are also clear:
– free users keep the default watermark
– custom watermarking is Pro-only
– 4K export is subscriber-only
– results still depend on the clarity of the prompt
Overall, this is a genuinely promising AI infographic generator for people who want to move from idea to visual draft quickly. If your priority is reducing the time and effort it takes to create a polished infographic, MakeInfographic.ai looks like one of the more practical tools in this category right now.