The Average U.S. Driver Pays $443 in Highway Taxes Each Year, New Study Finds
KEY HIGHLIGHTS
- The national average is $443 in highway taxes per licensed driver, yet only 18 of 50 states sit above that line, while 32 fall below it.
- Delaware collects the most at $928 per driver and Alaska the least at $156, a gap of $772, or roughly six times as much.
- Every driver dollar splits into about 43% fuel taxes, 36% vehicle and registration taxes, and 20% tolls, according to FHWA Highway Statistics 2024.
Every licensed driver in America helps pay for the roads they use, but the size of that contribution depends heavily on where they live. A new analysis ranks all 50 states by the total highway-user tax collected per driver, drawing on federal data. The figures point to a national average of $443 and a spread wide enough that the top state collects roughly six times the bottom.
An analysis of federal highway data by Kuzyk Personal Injury & Car Accident Lawyers draws on FHWA Highway Statistics 2024 (Tables SF-1 and DL-201). For each state, the number of licensed drivers is summed and divided by three highway-user revenue streams: motor-fuel taxes, motor-vehicle and motor-carrier taxes, and road and crossing tolls to produce a total highway tax per driver.
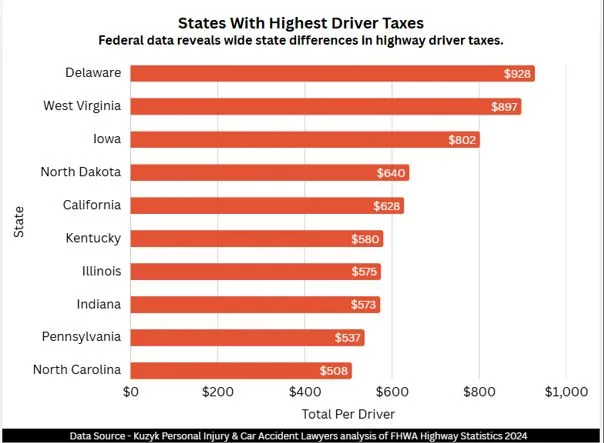
Table 1: Delaware Tops the Nation at $928 Per Driver, Nearly Double the Average
| Rank | State | Total Per Driver | Fuel | Vehicle | Tolls |
| 1 | Delaware | $928 | $103 | $169 | $656 |
| 2 | West Virginia | $897 | $347 | $389 | $161 |
| 3 | Iowa | $802 | $275 | $527 | $0 |
| 4 | North Dakota | $640 | $305 | $335 | $0 |
| 5 | California | $628 | $272 | $327 | $30 |
| 6 | Kentucky | $580 | $280 | $300 | $0 |
| 7 | Illinois | $575 | $209 | $186 | $180 |
| 8 | Indiana | $573 | $465 | $107 | $0 |
| 9 | Pennsylvania | $537 | $238 | $83 | $217 |
| 10 | North Carolina | $508 | $331 | $124 | $52 |
All 10 leading states collect more than $500 per driver, yet they reach that level through very different mixes: tolls in Delaware ($656), vehicle taxes in Iowa ($527), and fuel taxes in Indiana ($465). Delaware alone collects more than double the $443 national average.
Table 2: Alaska Collects Just $156 Per Driver, the Lowest in the Nation
| Rank | State | Total Per Driver |
| 41 | Mississippi | $292 |
| 42 | Nevada | $283 |
| 43 | Wyoming | $283 |
| 44 | Arkansas | $250 |
| 45 | Georgia | $249 |
| 46 | Massachusetts | $222 |
| 47 | Rhode Island | $216 |
| 48 | Louisiana | $176 |
| 49 | Arizona | $161 |
| 50 | Alaska | $156 |
Every state in the bottom 10 collects under $300 per driver, and the five lowest fall below $250, with Alaska at $156, collecting roughly one-sixth of Delaware’s $928. The spread shows how much a driver’s location shapes the total.
Table 3: In Toll States, Delaware Charges $656 Per Driver, While 22 States Charge Nothing
| State | Toll Per Driver |
| Delaware | $656 |
| New York | $380 |
| New Jersey | $330 |
| Pennsylvania | $217 |
| Maryland | $192 |
Toll collection is heavily concentrated, with all five leaders in the Northeast and mid-Atlantic, and Delaware’s $656 nearly twice the next-highest state, New York, at $380. Of all 50 states, 28 collect toll revenue while the other 22 collect none.
Table 4: Fuel Tax Is the Largest Source in 26 States; Vehicle Fees Lead in 15
Dominant Revenue Source, by Number of States
| Largest Revenue Source | Number of States |
| Motor-fuel tax | 26 |
| Motor-vehicle and registration tax | 15 |
| Tolls | 9 |
Motor-fuel tax is the largest source in 26 states, more than vehicle fees (15) and tolls (9) combined, and nationally the mix runs about 43% fuel, 36% vehicle and registration, and 20% tolls. Fuel remains the backbone of highway funding in most states.
Delaware vs. Alaska: A $772 Gap Between the Highest and Lowest States
| State | Total Per Driver | Position |
| Delaware | $928 | Highest |
| Alaska | $156 | Lowest |
Delaware collects $928 per driver against Alaska’s $156, a $772 gap that means the top state takes in roughly six times what the bottom one does. Location is the single biggest factor in how many drivers contribute.
Methodology
The three FHWA Highway Statistics 2024 SF-1 highway-user revenue columns (motor-fuel taxes, motor-vehicle and motor-carrier taxes, and road and crossing tolls) summed into a single total highway-user revenue figure for each state. That total is then divided by the number of licensed drivers reported in FHWA Table DL-201 to produce the total highway tax per driver. Each of the three components was also expressed on a per-driver basis to show the source mix within each state, and their total per-driver figure ranked the states. National, regional, and median values were derived from the same state-level figures.
Data Sources
- FHWA Highway Statistics 2024, Table SF-1: Revenues Used by States for Highways: https://www.fhwa.dot.gov/policyinformation/statistics/2024/sf1.cfm
- FHWA Highway Statistics 2024, Table DL-201: Licensed Drivers by State: https://www.fhwa.dot.gov/policyinformation/statistics/2024/dl201.cfm
- Research Dataset: https://docs.google.com/spreadsheets/d/1Bf1oRGxUoiFQ_3LBGpqygPaE-qs_gj34-uTgOSsFUXc/edit?gid=0#gid=0
- Research by: https://kuzyklaw.com/fresno/
About Kuzyk Personal Injury & Car Accident Lawyers
Kuzyk Personal Injury & Car Accident Lawyers is a California-based personal injury law firm specializing in intersection accidents and traffic-injury cases. The firm represents victims of negligent driving and unsafe roadway design while using data-driven research to inform public discussion and promote safer transportation systems nationwide.