Transform Your Data Into Stunning Visuals: How Anyone Can Master Charts Online
In today’s fast-paced digital world, data is everywhere. From business reports and school projects to blog analytics and personal finance tracking, information comes in overwhelming amounts. Yet even the most valuable data can fall flat if it isn’t presented clearly. That’s why data visualization is more than just a nice-to-have skill — it’s essential for communicating insights effectively.
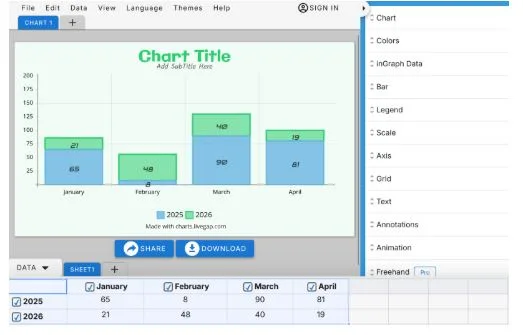
Enter Livegap Charts, a browser-based chart maker that empowers anyone to turn raw numbers into striking visuals in minutes. No downloads, no complicated software, and no design expertise required. Whether you’re a teacher, a business owner, or a content creator, Livegap Charts makes it simple to create charts that are both professional and compelling.
Why Visuals Matter More Than Ever
Humans process visuals far faster than text, making charts an indispensable tool for communication. A well-designed chart doesn’t just display numbers — it tells a story:
- Businesses can quickly identify trends, spot opportunities, and make informed decisions.
- Educators can engage students by presenting data in ways that are easy to understand and remember.
- Bloggers and marketers can transform boring statistics into eye-catching graphics that captivate readers.
The right visualization can turn complex information into a clear, actionable insight — and that’s exactly what Livegap Charts delivers.
Livegap Charts: Key Features That Make a Difference
- Wide Range of Chart Types – From line charts and bar graphs to radar, polar area, pie, and doughnut charts, Livegap Charts covers virtually every way to display data. Users can choose the format that best fits their message.
- Simple Data Input – Forget complicated formulas. Just copy-paste your spreadsheet data or enter it manually, and your chart updates instantly.
- Icons and Patterns for Impact – Highlight critical data points with icons or use patterns to differentiate sections of your chart. This makes your visuals not only easier to read but also more memorable.
- Fully Online and Accessible Anywhere – Since it’s browser-based, you can create charts on any device. For users seeking extra functionality, the Pro version offers unlimited customization and advanced features. Explore all options at Livegap Charts.
Tips for Creating Charts That Truly Stand Out
- Keep it clean and focused – Avoid overloading charts with too much information. Highlight what matters most.
- Choose the right chart type – Use line charts for trends, bar charts for comparisons, and pie charts for percentages.
- Use color strategically – Guide the viewer’s attention to important data points without overwhelming them.
- Label clearly – Every chart should be easy to interpret at a glance. Include axis labels, legends, and clear headings.
Making Charts Work for Everyone
Whether you’re presenting a report to executives, preparing a lesson for students, or sharing insights on a blog, charts make information more digestible. Tools like Livegap Charts have democratized data visualization — now anyone can create professional graphics without technical barriers.
For example, a small business owner can turn quarterly sales data into a colorful bar chart to quickly assess performance. A teacher can illustrate historical trends in population growth with a line graph that students instantly understand. Even bloggers and content creators can elevate posts with charts that engage readers while reinforcing key points.
Why Start Using Livegap Charts Today
In a world overflowing with information, clarity is everything. Livegap Charts provides a simple, effective, and visually appealing way to transform numbers into meaningful visuals. It’s accessible for beginners yet powerful enough for professionals, making it one of the most versatile online chart makers available today.
Creating charts with Livegap Charts is fast, intuitive, and effective — a perfect solution for anyone looking to bring data to life. Start visualizing smarter today at charts.livegap.com