U.S. Drivers Paid $16.4 Billion in Tolls, New 50-State Analysis Shows
Federal Highway Data Analysis Shows 27 States Collected $16.4B in Tolls, with Costs Varying Up to 720x Per Mile
| Key Findings
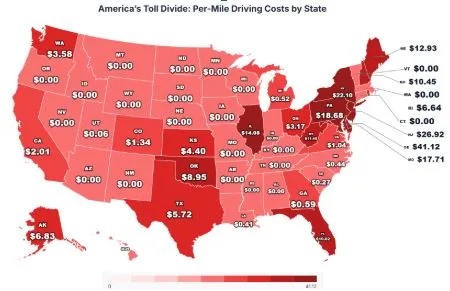
Delaware ranks #1 on the Toll Burden Index at $41.12 per 1,000 miles driven, more than 50% higher than second-place New Jersey ($26.92), making it the most toll-intensive state in America. The top 3 toll-burden states, Delaware, New Jersey, and New York, are all in the Northeast, where dense toll infrastructure drives per-mile costs far above the national average. Florida collects more than $2.39 billion in toll revenue, yet ranks only 10th in toll burden per mile ($10.02) due to its massive 239 billion vehicle-miles traveled. |
Tolls are a daily cost for millions of American drivers, but the burden isn’t distributed equally. A new state-by-state analysis reveals that where you drive matters as much as how far you drive, with small, corridor-heavy states charging dramatically more per mile than their larger counterparts.
The study, conducted by Beck & Beck, analyzed 2023 Federal Highway Administration data from the SF-1 (highway revenue) and VM-2 (vehicle-miles traveled) tables to calculate the toll cost per mile driven in every U.S. state, creating the Toll Burden Index.
Top 10 States by Toll Burden Per 1,000 Miles
| Rank | State | Toll Revenue | Total VMT (millions) | Toll $ per 1,000 Miles |
| 1 | Delaware | $399,616,000 | 9,718 | $41.12 |
| 2 | New Jersey | $2,100,258,000 | 78,007 | $26.92 |
| 3 | New York | $2,653,989,000 | 120,067 | $22.10 |
| 4 | Pennsylvania | $1,870,579,000 | 100,126 | $18.68 |
| 5 | Maryland | $1,016,004,000 | 57,356 | $17.71 |
| 6 | Illinois | $1,448,722,000 | 102,871 | $14.08 |
| 7 | Maine | $192,573,000 | 14,888 | $12.93 |
| 8 | West Virginia | $182,799,000 | 15,962 | $11.45 |
| 9 | New Hampshire | $141,217,000 | 13,515 | $10.45 |
| 10 | Florida | $2,395,649,000 | 239,188 | $10.02 |
Delaware leads the nation with a toll burden of $41.12 per 1,000 miles driven, more than 50% higher than second-place New Jersey ($26.92). Despite collecting relatively modest total revenue ($399.6 million), Delaware’s small size and heavy toll-road usage concentrate costs on a smaller pool of vehicle-miles. Seven of the top 10 states are located east of the Mississippi, with the Northeast corridor dominating the list. Florida, despite ranking 10th in per-mile burden, collects the second-highest total toll revenue in the country at $2.4 billion.
| “This data shows just how unevenly toll costs hit American drivers. A commuter in Delaware pays more than 720 times per mile what a driver in Utah does. Meanwhile, drivers in Missouri pay nothing at all in tolls, as the state reported zero toll revenue in 2023. For anyone involved in a highway accident in a toll-heavy state, understanding these costs is part of knowing your rights on the road.”
— John Beck, Attorney & Founding Partner, Beck & Beck |
Top 10 States by Total Toll Revenue
| Rank | State | Toll Revenue | Total VMT (millions) | Toll $ per 1,000 Miles |
| 1 | New York | $2,653,989,000 | 120,067 | $22.10 |
| 2 | Florida | $2,395,649,000 | 239,188 | $10.02 |
| 3 | New Jersey | $2,100,258,000 | 78,007 | $26.92 |
| 4 | Pennsylvania | $1,870,579,000 | 100,126 | $18.68 |
| 5 | Texas | $1,717,982,000 | 300,338 | $5.72 |
| 6 | Illinois | $1,448,722,000 | 102,871 | $14.08 |
| 7 | Maryland | $1,016,004,000 | 57,356 | $17.71 |
| 8 | California | $637,917,000 | 316,612 | $2.01 |
| 9 | Oklahoma | $409,688,000 | 45,760 | $8.95 |
| 10 | Delaware | $399,616,000 | 9,718 | $41.12 |
New York collects the most toll revenue nationally at $2.65 billion, followed by Florida ($2.40 billion) and New Jersey ($2.10 billion). However, high total revenue does not always mean a high per-mile burden. Texas ranks 5th in total toll collection ($1.72 billion) but only 14th in toll burden per mile ($5.72) because its 300.3 billion vehicle-miles traveled dilute the per-mile cost. Similarly, California collects $637.9 million but ranks just 18th per mile ($2.01) thanks to its nation-leading 316.6 billion VMT.
Lowest Toll Burden Among Toll States
| Rank | State | Toll Revenue | Total VMT (millions) | Toll $ per 1,000 Miles |
| 1 | Tennessee | $43,000 | 83,405 | $0.00 |
| 2 | Utah | $1,975,000 | 34,584 | $0.06 |
| 3 | South Carolina | $16,597,000 | 60,794 | $0.27 |
| 4 | Louisiana | $22,723,000 | 55,560 | $0.41 |
| 5 | North Carolina | $54,096,000 | 122,258 | $0.44 |
| 6 | Michigan | $50,845,000 | 98,289 | $0.52 |
| 7 | Georgia | $74,418,000 | 126,339 | $0.59 |
| 8 | Virginia | $90,880,000 | 87,730 | $1.04 |
| 9 | Colorado | $73,023,000 | 54,654 | $1.34 |
| 10 | California | $637,917,000 | 316,612 | $2.01 |
Among the 27 states that do collect tolls, the burden varies enormously. Tennessee has the lowest toll burden of any toll state, collecting just $43,000 total, effectively zero per mile. Utah ($0.06 per 1,000 miles), South Carolina ($0.27), and Louisiana ($0.41) also maintain near-negligible toll costs. These states demonstrate that having toll infrastructure does not necessarily mean a meaningful cost to drivers.
Methodology
Study Overview
Beck & Beck analyzed publicly available federal highway data to calculate the toll cost per mile driven in every U.S. state, creating a Toll Burden Index that ranks states by how much their drivers effectively pay in tolls per distance traveled.
Step 1: Extract Toll Revenue
Toll revenue data was extracted from the FHWA Highway Statistics 2023 Table SF-1 (Revenues Used by States for Highways). Specifically, the “Road and Crossing Tolls” column was used to identify each state’s total toll collections for the 2023 fiscal year.
Step 2: Extract Vehicle-Miles Traveled (VMT)
Total vehicle-miles traveled (VMT) for each state was obtained from the FHWA Highway Statistics 2023 Table VM-2 (Functional System Travel). The total VMT column, measured in millions of miles, represents all vehicle travel on public roads within each state.
Step 3: Calculate Toll Burden Per Mile
For each state, the Toll Burden was calculated as: Toll Revenue ($) ÷ Total VMT (miles) = Toll Cost Per Mile. The result was then multiplied by 1,000 for readability, producing a “Toll Dollars Per 1,000 Miles” figure. States were ranked from highest to lowest toll burden.
Step 4: Categorize Toll vs. Non-Toll States
States reporting $0 in the Road and Crossing Tolls column of SF-1 were classified as non-toll states. A total of 27 states reported toll revenue; 24 states (including D.C.) reported zero toll revenue.
Data Sources
- FHWA Highway Statistics 2023, Table SF-1 (Revenues Used by States for Highways): https://www.fhwa.dot.gov/policyinformation/statistics/2023/sf1.cfm
- FHWA Highway Statistics 2023, Table VM-2 (Functional System Travel): https://www.fhwa.dot.gov/policyinformation/statistics/2023/vm2.cfm
- Research Dataset: https://docs.google.com/spreadsheets/d/1IIegfOuWiUg8BFwc7FgHot8wrm3o5liZ/edit?gid=1081401896#gid=1081401896
- Study by: https://becklawmo.com/
About Beck & Beck
Beck & Beck, Missouri Car Accident Lawyers, is an experienced law firm focused on vehicle accident representation. The firm supports clients from early claim evaluation through medical care coordination and insurance negotiations, advocating aggressively for fair outcomes after serious crashes. For more information or media inquiries related to this report, contact our team. For more information, visit https://becklawmo.com/