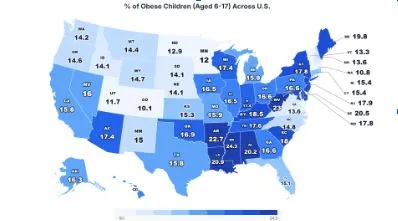
Child Obesity Exceeds 20% in 6 U.S. States While Best States Stay Under 11%
KEY FINDINGS
| • The three states (Mississippi, West Virginia, Arkansas) with the highest childhood obesity rates each report more than one in five children aged 6-17 classified as obese, rates exceeding 22%. |
| • Seven of the ten states with the highest child weight-related health risk are located in the South, revealing a pronounced regional concentration. |
| • The three states (Colorado, Massachusetts, Utah) with the lowest childhood obesity rates each report rates below 12%, with the best-performing state achieving just 10.1%. |
California has become the first state to ban ultra-processed foods from school meals. But new data reveals the states that need similar reforms most urgently are thousands of miles away, where up to four in ten children are already overweight or obese.
The study conducted by Birth Injury Lawyers Group analyzed 2023-2024 NSCH data to rank all 50 U.S. states by child weight-related health risk, using a composite Health Risk Score that weights obesity rates at 60% and overweight rates at 40%, normalized on a 0 – 100 scale. Weight status followed CDC BMI-for-age standards across children aged 6-17, with Rank 1 indicating the highest risk and Rank 50 the lowest.
STATES WITH THE HIGHEST CHILD WEIGHT-RELATED HEALTH RISK
| Rank | State | Obesity Rate | Overweight Rate | Combined Rate | Normal Weight Rate |
|---|---|---|---|---|---|
| 1 | Mississippi | 24.3% | 17.5% | 41.8% | 50.3% |
| 2 | Arkansas | 22.7% | 17.5% | 40.2% | 51.2% |
| 3 | West Virginia | 23.0% | 16.7% | 39.7% | 55.0% |
| 4 | Louisiana | 20.9% | 14.8% | 35.7% | 57.5% |
| 5 | Delaware | 20.5% | 15.2% | 35.7% | 56.3% |
| 6 | Alabama | 20.2% | 15.5% | 35.7% | 55.7% |
| 7 | South Carolina | 18.0% | 17.4% | 35.4% | 56.5% |
| 8 | Maine | 19.8% | 14.7% | 34.5% | 58.9% |
| 9 | Kentucky | 18.5% | 16.0% | 34.5% | 56.8% |
| 10 | Tennessee | 17.6% | 16.3% | 33.9% | 57.6% |
Table 1: Ten states with the highest child weight-related health risk, ranked by composite Health Risk Score. Data: NSCH 2023 – 2024.
Six states exceed the 20% obesity threshold, significantly above the national average of 16.25%. Mississippi, the top-ranked state, is the only one where fewer than 51% of children maintain a normal weight, with combined overweight and obesity affecting 41.8% of children.
REGIONAL DISTRIBUTION OF HIGHEST-RISK STATES
| Region | States in Top 10 | States Listed |
|---|---|---|
| South | 7 | Mississippi, Arkansas, Louisiana, Alabama, South Carolina, Kentucky, Tennessee |
| Mid-Atlantic | 2 | Delaware, West Virginia |
| Northeast | 1 | Maine |
Table 2: Regional breakdown of states appearing in the top 10 for child weight-related health risk.
The regional concentration is striking, with Southern states comprising 70% of the highest-risk group. The two non-Southern outliers, Delaware (5th) and Maine (8th), rank highly despite neighboring states achieving significantly better outcomes.
DISPARITY BETWEEN BEST AND WORST PERFORMING STATES
| Metric | Highest-Risk State | Lowest-Risk State | Gap |
|---|---|---|---|
| Child Obesity Rate | 24.3% | 10.1% | 14.2 pp |
| Child Overweight Rate | 17.5% | 13.0% | 4.5 pp |
| Combined Overweight + Obese | 41.8% | 23.1% | 18.7 pp |
| Normal Weight Rate | 50.3% | 67.6% | 17.3 pp |
Table 3: Key metric comparison between the highest-risk state (Mississippi) and lowest-risk state (Colorado). pp = percentage points.
Mississippi, the highest-risk state’s obesity rate is 2.41 times as high as the lowest-risk state’s (Colorado). A child in the worst-performing state is nearly two and a half times as likely to be obese as a child in the best-performing state.
STATES WITH THE LOWEST CHILD WEIGHT-RELATED HEALTH RISK
| Rank | State | Obesity Rate | Overweight Rate | Combined Rate | Normal Weight Rate |
|---|---|---|---|---|---|
| 41 | Washington | 14.2% | 14.5% | 28.7% | 61.7% |
| 42 | Nebraska | 14.1% | 14.0% | 28.1% | 63.6% |
| 43 | Vermont | 13.3% | 14.6% | 27.9% | 64.1% |
| 44 | New Hampshire | 13.6% | 14.2% | 27.8% | 64.9% |
| 45 | Virginia | 13.6% | 13.5% | 27.1% | 66.0% |
| 46 | Minnesota | 12.0% | 15.1% | 27.1% | 66.0% |
| 47 | Idaho | 14.1% | 12.5% | 26.6% | 62.9% |
| 48 | Massachusetts | 10.8% | 14.5% | 25.3% | 64.9% |
| 49 | Utah | 11.7% | 12.9% | 24.6% | 64.6% |
| 50 | Colorado | 10.1% | 13.0% | 23.1% | 67.6% |
Table 4: Ten states with the lowest child weight-related health risk, ranked by composite Health Risk Score. Data: NSCH 2023 – 2024.
Only two states report childhood obesity rates below 11% (Massachusetts, Colorado), achieving normal weight rates above 64%. Western and New England states dominate the lowest-risk rankings, with combined at-risk rates between 23.1% and 28.7%.
CHILD WEIGHT-RELATED HEALTH RISK IN THE FIVE MOST POPULOUS STATES
| State | National Rank | Obesity Rate | Combined Rate | Health Risk Score |
|---|---|---|---|---|
| Texas | 20 | 15.8% | 31.7% | 75.36 |
| New York | 24 | 17.8% | 31.3% | 74.81 |
| Florida | 26 | 15.1% | 31.5% | 74.77 |
| California | 28 | 15.8% | 31.2% | 74.21 |
| Pennsylvania | 31 | 16.6% | 30.9% | 73.67 |
Table 5: Child weight-related health risk profile of the five most populous U.S. states.
All five most populous states cluster between ranks 20 and 31, placing them in the middle tier nationally. None appear in either the top 10 or bottom 10 for weight-related health risk.
COMPLETE STATE-BY-STATE RANKINGS
| Rank | State | Obesity Rate | Overweight Rate | Combined Rate | Health Risk Score |
|---|---|---|---|---|---|
| 1 | Mississippi | 24.3% | 17.5% | 41.8% | 100.00 |
| 2 | Arkansas | 22.7% | 17.5% | 40.2% | 96.05 |
| 3 | West Virginia | 23.0% | 16.7% | 39.7% | 94.96 |
| 4 | Louisiana | 20.9% | 14.8% | 35.7% | 85.43 |
| 5 | Delaware | 20.5% | 15.2% | 35.7% | 85.36 |
| 6 | Alabama | 20.2% | 15.5% | 35.7% | 85.31 |
| 7 | South Carolina | 18.0% | 17.4% | 35.4% | 84.22 |
| 8 | Maine | 19.8% | 14.7% | 34.5% | 82.49 |
| 9 | Kentucky | 18.5% | 16.0% | 34.5% | 82.25 |
| 10 | Tennessee | 17.6% | 16.3% | 33.9% | 80.71 |
| 11 | Georgia | 16.6% | 16.5% | 33.1% | 78.70 |
| 12 | Wisconsin | 17.4% | 15.5% | 32.9% | 78.39 |
| 13 | Oklahoma | 16.9% | 15.9% | 32.8% | 78.07 |
| 14 | Ohio | 16.6% | 15.9% | 32.5% | 77.33 |
| 15 | Arizona | 17.4% | 15.0% | 32.4% | 77.25 |
| 16 | Alaska | 16.3% | 16.0% | 32.3% | 76.82 |
| 17 | New Mexico | 15.0% | 17.3% | 32.3% | 76.58 |
| 18 | Nevada | 16.0% | 16.2% | 32.2% | 76.53 |
| 19 | Missouri | 15.9% | 16.0% | 31.9% | 75.83 |
| 20 | Texas | 15.8% | 15.9% | 31.7% | 75.36 |
| 21 | North Carolina | 14.8% | 16.9% | 31.7% | 75.17 |
| 22 | Illinois | 16.5% | 15.0% | 31.5% | 75.03 |
| 23 | Rhode Island | 15.4% | 16.1% | 31.5% | 74.82 |
| 24 | New York | 17.8% | 13.5% | 31.3% | 74.81 |
| 25 | Iowa | 16.5% | 14.9% | 31.4% | 74.80 |
| 26 | Florida | 15.1% | 16.4% | 31.5% | 74.77 |
| 27 | Maryland | 17.8% | 13.4% | 31.2% | 74.58 |
| 28 | California | 15.8% | 15.4% | 31.2% | 74.21 |
| 29 | South Dakota | 14.1% | 17.1% | 31.2% | 73.90 |
| 30 | Michigan | 15.8% | 15.2% | 31.0% | 73.76 |
| 31 | Pennsylvania | 16.6% | 14.3% | 30.9% | 73.67 |
| 32 | Connecticut | 15.4% | 15.3% | 30.7% | 73.00 |
| 33 | Kansas | 15.3% | 15.4% | 30.7% | 72.98 |
| 34 | Indiana | 17.4% | 12.9% | 30.3% | 72.45 |
| 35 | Montana | 14.4% | 15.5% | 29.9% | 70.98 |
| 36 | Oregon | 14.6% | 15.1% | 29.7% | 70.56 |
| 37 | Hawaii | 16.8% | 12.6% | 29.4% | 70.28 |
| 38 | North Dakota | 12.9% | 16.7% | 29.6% | 70.02 |
| 39 | Wyoming | 14.7% | 14.5% | 29.2% | 69.44 |
| 40 | New Jersey | 17.9% | 10.6% | 28.5% | 68.43 |
| 41 | Washington | 14.2% | 14.5% | 28.7% | 68.20 |
| 42 | Nebraska | 14.1% | 14.0% | 28.1% | 66.81 |
| 43 | Vermont | 13.3% | 14.6% | 27.9% | 66.21 |
| 44 | New Hampshire | 13.6% | 14.2% | 27.8% | 66.04 |
| 45 | Virginia | 13.6% | 13.5% | 27.1% | 64.44 |
| 46 | Minnesota | 12.0% | 15.1% | 27.1% | 64.14 |
| 47 | Idaho | 14.1% | 12.5% | 26.6% | 63.39 |
| 48 | Massachusetts | 10.8% | 14.5% | 25.3% | 59.81 |
| 49 | Utah | 11.7% | 12.9% | 24.6% | 58.37 |
| 50 | Colorado | 10.1% | 13.0% | 23.1% | 54.65 |
Table 6: Complete state-by-state rankings. Health Risk Score is normalized on a 0-100 scale where 100 = highest risk. Data: NSCH 2023 – 2024.
METHODOLOGY
The study analyzed 2023-2024 National Survey of Children’s Health data to rank all 50 U.S. states by child weight-related health risk. A composite Health Risk Score was calculated using obesity rates (weighted at 60%) and overweight rates (weighted at 40%), normalized on a 0-100 scale where 100 represents the highest risk. Weight classifications followed CDC BMI-for-age percentile standards: underweight (below the 5th percentile), normal weight (5th to less than 85th percentile), overweight (85th to less than 95th percentile), and obese (95th percentile or above). The 60/40 weighting reflects obesity’s greater long-term health consequences. States were ranked 1 through 50, with Rank 1 indicating highest risk, covering children aged 6-17.
DATA SOURCES
National Survey of Children’s Health (NSCH): Child and Adolescent Health Measurement Initiative
https://www.childhealthdata.org/browse/survey/results?q=11853&r=2&r2=6
Research Dataset: https://docs.google.com/spreadsheets/d/13IcIYXBz5ScDLvjqIl_T1uYqZ97ssaNo8lR8aFRN334/edit?gid=0#gid=0
Study by: https://birthinjurylawyer.com/
ABOUT BIRTH INJURY LAWYERS GROUP
Birth Injury Lawyers Group is a legal advocacy organization dedicated to supporting children and families affected by preventable birth injuries and child health issues. The firm’s commitment to child wellbeing extends to research and public health analysis that informs policy decisions affecting children’s long-term health outcomes.