Pedestrians Make Up Half of All Fatal Crashes in Major U.S. Cities
Key Findings
- Seattle, the most dangerous major U.S. city for pedestrians, reports 55.29% of all fatal traffic crashes involving pedestrian deaths, three times the rate of the safest city at 18.40%.
- California dominates the danger rankings, placing 9 of its cities in the top 20 for pedestrian fatality rates, revealing a concentrated regional crisis.
- Midwest and Mountain West cities offer the greatest pedestrian safety, with the safest cities recording pedestrian death rates below 21%.
Every year, thousands of pedestrians lose their lives on the streets of America’s largest cities. But their risk is far from equal. In Seattle and San Francisco, pedestrians face the greatest danger in the nation. In Omaha and Colorado Springs, the streets tell a safer story. The difference between life and death often comes down to which city you call home.
The study, conducted by Anidjar & Levine, examined fatal crashes across America’s 50 largest cities from 2019 to 2023. Cities were ranked by the percentage of fatal crashes involving pedestrian deaths, measuring proportional risk to pedestrians relative to all traffic fatalities.
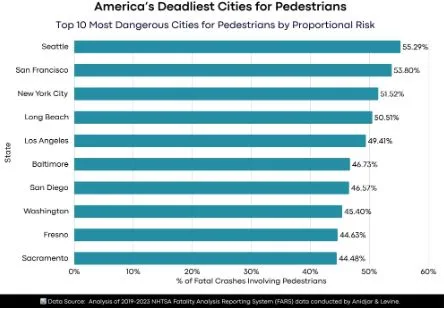
Top 10 Most Dangerous Cities for Pedestrians by Proportional Risk
| Rank | City | State | % of Fatal Crashes Involving Pedestrians | Avg. Annual Pedestrian Deaths |
| 1 | Seattle | Washington | 55.29% | 19 |
| 2 | San Francisco | California | 53.80% | 18 |
| 3 | New York City | New York | 51.52% | 116 |
| 4 | Long Beach | California | 50.51% | 20 |
| 5 | Los Angeles | California | 49.41% | 150 |
| 6 | Baltimore | Maryland | 46.73% | 20 |
| 7 | San Diego | California | 46.57% | 46 |
| 8 | Washington | District of Columbia | 45.40% | 15 |
| 9 | Fresno | California | 44.63% | 27 |
| 10 | Sacramento | California | 44.48% | 26 |
West Coast cities dominate the highest-risk rankings, with 7 of the top 10 located in the region. The top four cities are the only major U.S. cities where pedestrians account for more than half of all traffic deaths.
Expert Commentary
Looking at the study, a spokesperson from Anidjar & Levine commented:
| “These findings underscore a troubling reality for pedestrians in many of America’s largest cities. When more than half of fatal crashes in certain cities involve pedestrians, it signals systemic infrastructure and safety challenges that demand attention from policymakers and urban planners alike.” |
California Cities Dominating the Top 20 Rankings
| National Rank | City | State | % of Fatal Crashes Involving Pedestrians | Avg. Annual Pedestrian Deaths |
| 2 | San Francisco | California | 53.80% | 18 |
| 4 | Long Beach | California | 50.51% | 20 |
| 5 | Los Angeles | California | 49.41% | 150 |
| 7 | San Diego | California | 46.57% | 46 |
| 9 | Fresno | California | 44.63% | 27 |
| 10 | Sacramento | California | 44.48% | 26 |
| 13 | San Jose | California | 42.73% | 29 |
| 16 | Oakland | California | 41.52% | 14 |
| 17 | Bakersfield | California | 41.51% | 22 |
California places 9 cities in the top 20, spanning Northern, Central, and Southern regions. This statewide concentration suggests systemic factors, including climate, urban design, and vehicle trends, may contribute to elevated pedestrian risk.
10 U.S. Cities With the Highest Annual Pedestrian Death Tolls
| Rank | City | State | Avg. Annual Pedestrian Deaths (2019-2023) | % of Fatal Crashes |
| 1 | Los Angeles | California | 150 | 49.41% |
| 2 | New York City | New York | 116 | 51.52% |
| 3 | Phoenix | Arizona | 103 | 40.05% |
| 4 | Houston | Texas | 99 | 35.20% |
| 5 | Dallas | Texas | 68 | 34.90% |
| 6 | Memphis | Tennessee | 62 | 31.86% |
| 7 | San Antonio | Texas | 60 | 35.70% |
| 8 | Chicago | Illinois | 60 | 35.12% |
| 9 | Philadelphia | Pennsylvania | 51 | 40.29% |
| 10 | San Diego | California | 46 | 46.57% |
High overall crash volumes drive raw death counts even in cities with moderate proportional rates. The top-ranked city for raw deaths averages 150 pedestrian fatalities annually, nearly eight times more than the safest city.
Cities With the Largest Increases in Pedestrian Fatalities (2019 vs. 2023)
| City | State | 2019 Deaths | 2023 Deaths | Change | % Change |
| Fort Worth | Texas | 20 | 46 | +26 | +130% |
| Philadelphia | Pennsylvania | 29 | 61 | +32 | +110% |
| Denver | Colorado | 16 | 28 | +12 | +75% |
| Memphis | Tennessee | 36 | 59 | +23 | +64% |
| Phoenix | Arizona | 90 | 116 | +26 | +29% |
| Albuquerque | New Mexico | 45 | 55 | +10 | +22% |
| San Antonio | Texas | 63 | 75 | +12 | +19% |
Two cities experienced pedestrian deaths more than doubling over the five-year period. The steepest increases occurred in Sun Belt and Mid-Atlantic cities, signaling worsening conditions for pedestrians in these regions.
10 Safest Large U.S. Cities for Pedestrians
| Rank | City | State | % of Fatal Crashes Involving Pedestrians | Avg. Annual Pedestrian Deaths |
| 41 | Mesa | Arizona | 28.85% | 15 |
| 42 | Jacksonville | Florida | 28.35% | 44 |
| 43 | Indianapolis | Indiana | 27.60% | 33 |
| 44 | Louisville | Kentucky | 27.59% | 29 |
| 45 | Milwaukee | Wisconsin | 25.66% | 17 |
| 46 | Arlington | Texas | 23.86% | 8 |
| 47 | Virginia Beach | Virginia | 20.83% | 6 |
| 48 | Kansas City | Missouri | 20.60% | 17 |
| 49 | Colorado Springs | Colorado | 19.23% | 9 |
| 50 | Omaha | Nebraska | 18.40% | 6 |
Midwest and Mountain West cities dominate the safest rankings, with five of the bottom 10 located in these regions. The disparity between the most and least dangerous cities spans a factor of three, demonstrating how dramatically pedestrian risk varies across American metropolitan areas.
Methodology
This analysis utilized data from the NHTSA Fatality Analysis Reporting System (FARS), accessed via the CDAN Query Tool, examining fatal motor vehicle traffic crashes involving at least one pedestrian fatality across the 50 most populous U.S. cities for calendar years 2019 through 2023. For each city, total pedestrian fatalities were summed across all five years and divided by five to calculate the average annual pedestrian deaths, which were then divided by the average annual fatal crashes to determine the percentage of fatal crashes involving pedestrians. Cities were ranked from highest to lowest percentage, with this metric measuring proportional risk to pedestrians relative to all traffic deaths.
Data Sources
-
- NHTSA CDAN Query Tool: https://cdan.dot.gov/query
- NHTSA Traffic Safety Facts 2023: https://crashstats.nhtsa.dot.gov/Api/Public/ViewPublication/813727
- CDC MMWR Pedestrian Death Rates Study (March 2025): https://www.cdc.gov/mmwr/volumes/74/wr/mm7408a2.htm
- Governors Highway Safety Association (GHSA) Pedestrian Fatalities Report: https://www.ghsa.org/resource-hub/pedestrian-traffic-fatalities-2024-data
- Research Dataset: https://docs.google.com/spreadsheets/d/1rEO9jIZ2SutfZ5NsLcODYyWlgscgq5BiIn3mEE42Z3A/edit?gid=0#gid=0
- Study by: https://www.anidjarlevine.com/
About Anidjar & Levine
Anidjar & Levine is a personal injury law firm with extensive experience representing victims of serious traffic injuries and wrongful death, including pedestrian accidents. The firm is dedicated to protecting clients’ rights and helping them receive full compensation for their injuries.